by Mark Schultz
December 2018
Waseca County rests in the South Central region of Minnesota and lies on the border of the Southeast Economic Development Region. In 1854 Asa Sutlief filed the first land claim in Wilton Township, and the first blacksmith shop was opened in 1856 by H.P. Norton. However, Waseca County was not officially established until February of 1857. The following year the first physician, Dr. M.S. Gove, came to the county, and in 1859 Scotch Fife wheat was first planted. The wheat farmers transported their harvests to Hastings, Minnesota, for only .62 cents per bushel. Interestingly, the county had Horse Thief Detectives that were established in 1864 after a group of individuals were caught stealing horses.
Waseca County experienced a small population decline from 2000 to 2017 with a drop of 739 people (3.8 percent). During this time frame the labor force saw a more sizable decrease, falling 11.7 percent (1,247 people). Over half (52.9 percent to be exact) of the county's residents leave the county to work in nearby counties, which equals an exodus of about 4,870 residents. However, the county also draws in about 2,770 non-residents to work in jobs within the county. The largest number of residents who leave the county for work commute to Blue Earth (13.3 percent) and Steele (12.2 percent) Counties, while Steele County (7 percent) and Blue Earth (6.9 percent) also send the most workers into the county for work.
Of the total industries within Waseca County, the top five make up almost 70 percent (69.7) of the estimated 6,412 jobs in 504 firms. The largest employing industry is Manufacturing which accounts for 23.4 percent of the jobs in the county. Rounding out the top five industries in the county are Health Care and Social Assistance (1,140 jobs in 54 firms), Retail Trade (642 jobs in 57 firms), Educational Services (596 jobs in nine firms), and Public Administration (586 jobs in 28 firms).
In general, the county saw job loss of 15.4 percent from 2010-2017, which amounted to 1,171 fewer jobs across all industries. Manufacturing saw the largest decrease by dropping 657 jobs, and Health Care and Social Assistance saw the second highest drop with a loss of 268 jobs. In contrast, Construction saw the biggest increase during this time with a jump of only 80 jobs, and Wholesale Trade had the second highest job gain with an increase of 52 jobs.
| Economy | ||
|---|---|---|
| Estimates | Waseca County | Minnesota |
| Population (2017 Annual Estimate) | 18,787 | 5,576,606 |
| Labor Force (9/2018) | 9,443 | 3,072,947 |
| Unemployment Rate (9/2018) | 2.5% | 2.2% |
| Household Income (2016) | $53,199 | $63,217 |
| Cost of Living Wage Requirement (Individual/No Children) | $13.00 | $15.22 |
| Cost of Living Wage Requirement (Average Family)* | $14.84 | $18.47 |
| Source: DEED Local Area Unemployment Statistics, DEED Cost of Living, U.S. Census, American Community Survey
*Average Family – 2 parents, 1 full-time/1 part-time, 1 child |
||
| Industry | |||||
|---|---|---|---|---|---|
| Total 2017 Employment | 2010-2017 Change | Average 2017 Annual Wages | 2010-2017 Change | ||
| Total, All Industries | 6,412 | -1,171 (-15.4%) | $40,872 | $8,268 (25.4%) | |
| Manufacturing | 1,502 | -657 (-30.4%) | $58,656 | $12,064 (25.9%) | |
| Health Care and Social Assistance | 1,140 | -268 (-19.0%) | $29,848 | $8,372 (39.0%) | |
| Retail Trade | 642 | -78 (-10.8%) | $25,064 | $5,200 (26.2%) | |
| Educational Services | 596 | -27 (-4.3%) | $38,012 | $7,592 (25.0%) | |
| Public Administration | 586 | -11 (-1.8%) | $52,832 | $9,152 (21.0%) | |
| Source: DEED Quarterly Census of Employment and Wages | |||||

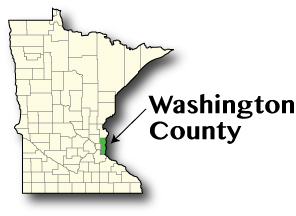
Named after George Washington, Washington County was one of the nine original counties established with the organization of the Minnesota Territory and was officially founded on October 27, 1849. Given that the county was profoundly forested, the early economy was based on logging and lumber, and the county's position on the St. Croix River made it possible to move logs down the river while also providing a means of transportation up the river.
Washington County saw a hefty increase in population from 2000 to 2017, increasing by 27.5 percent (55,218 new residents) and is currently ranked as the fifth most populous county in the state. During this time the labor force also saw a sizable increase, jumping by almost 22,600 participants, a 19.1 percent increase. Over three-quarters (76.4 percent) of county residents leave the county for work while almost 60 percent (59.9 percent) of the county's workers commute in from other counties. Of those residents who commute out of the county for work, the largest number go to Ramsey County (31.5 percent) and Hennepin County (24.1 percent). In contrast, the largest number of non-residents who come into the county for work come from Ramsey County (17.3 percent), Dakota County (8.2 percent), and an additional 6.9 percent that come from St. Croix County in Wisconsin.
Of the total industries in Washington County, the top five make up over 60 percent (61.1) of the estimated 84,751 jobs in 5,489 firms. The largest employing industry is Retail Trade which accounts for 16.1 percent of the jobs in the county. It is, unfortunately, the third lowest paying industry in the county. Rounding out the top five industries in the county are Health Care and Social Assistance (11,813 jobs in 609 firms), Manufacturing (9,482 jobs in 220 firms), Accommodation and Food Services (9,460 jobs in 411 firms), which is also the second lowest paying industry in the county, and Educational Services (7,434 jobs in 146 firms).
In general, Washington County saw job increase of 18.9 percent from 2010-2017, which amounted to a gain of almost 13,500 jobs across all industries. Health Care and Social Assistance saw the largest job increase, gaining 3,007 jobs (34.1 percent) during this time period, followed by Retail Trade which jumped by 2,123 jobs (18.4 percent). Unfortunately, there were two industries that experienced job loss over the last 17 years, including a drop of 223 jobs (7.7 percent) in Transportation and Warehousing and 802 fewer jobs (20.2 percent) in Finance and Insurance.
| Economy | ||
|---|---|---|
| Estimates | Washington County | Minnesota |
| Population (2017 Annual Estimate) | 256,348 | 5,576,606 |
| Labor Force (9/2018) | 142,491 | 3,072,947 |
| Unemployment Rate (9/2018) | 2.1% | 2.2% |
| Household Income (2016) | $86,689 | $63,217 |
| Cost of Living Wage Requirement (Individual/No Children) | $16.41 | $15.22 |
| Cost of Living Wage Requirement (Average Family)* | $20.28 | $18.47 |
| Source: DEED Local Area Unemployment Statistics, DEED Cost of Living, U.S. Census, American Community Survey
*Average Family – 2 parents, 1 full-time/1 part-time, 1 child |
||
| Industry | |||||
|---|---|---|---|---|---|
| Total 2017 Employment | 2010-2017 Change | Average 2017 Annual Wages | 2010-2017 Change | ||
| Total, All Industries | 84,751 | 13,459 (18.9%) | $46,904 | $8,164 (21.1%) | |
| Retail Trade | 13,633 | 2,123 (18.4%) | $26,000 | $3,536 (15.7%) | |
| Health Care and Social Assistance | 11,813 | 3,007 (34.1%) | $52,312 | $8,788 (20.2%) | |
| Manufacturing | 9,482 | 1,990 (26.6%) | $68,692 | $8,580 (14.3%) | |
| Accommodation and Food Services | 9,460 | 1,582 (20.1%) | $17,680 | $3,848 (27.8%) | |
| Educational Services | 7,434 | 162 (2.2%) | $44,460 | $6,500 (17.1%) | |
| Source: DEED Quarterly Census of Employment and Wages | |||||

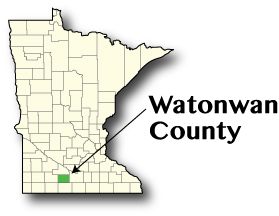
Encompassing 440 square miles, Watonwan County was organized in 1860, just two years after Minnesota was recognized as a state. The county is home to 17 lakes which cover approximately five square miles. The county's name is derived from the word "watanwan", which is a Dakota word for "fish bait". St. James was named the county seat in 1895, and in that same year the current courthouse was erected. The county was also home to one of Minnesota's Governors, Winfield Scott Hammond, who was elected on January 5, 1915.
Watonwan County saw a population decrease of just over 1,000 residents from 2000 to 2017, a drop of 8.7 percent, leaving the county ranked as the 65th largest county in the state. Despite this drop in population, the county's labor force has seen an overall increase during this same time frame. While experiencing ebbs and flows, the labor force has jumped by 7.7 percent, an increase of 468 participants. Almost half (48.3 percent) of Watonwan County's residents leave the county for work while only 37.3 percent of the county's workers commute in from other counties. Of those residents that commute out of the county for work, the largest number go to Blue Earth County (10.6 percent) and Cottonwood County (6.5 percent). In contrast, the largest number of non-residents who come into the county for work come from Martin County (5.2 percent) and Blue Earth County (4.9 percent).
Of the total industries in Watonwan County, the top five make up 64 percent of the estimated 4,338 jobs in 316 firms. The largest employing industry is Manufacturing which accounts for almost 30 percent of the jobs in the county. Rounding out the top five industries in the county are Health Care and Social Assistance (449 jobs in 21 firms), Educational Services (346 jobs in six firms), Public Administration (347 jobs in 22 firms), and Transportation and Warehousing (343 jobs in 32 firms).
In general, Watonwan County saw a job increase of 10.5 percent from 2010-2017, which amounted to a gain of just over 400 jobs across all industries. Transportation and Warehousing saw the largest job increase, gaining 159 jobs (86.4 percent) during this time period, followed by Manufacturing which jumped by 129 jobs (11.4 percent). Unfortunately, there were three industries that experienced job loss over the last seven years, including a drop of 11 jobs (5.7 percent) in Accommodation and Food Service, 15 fewer Information jobs (22.7 percent), and 49 fewer jobs (37.4 percent) in Administrative and Support and Waste Management and Remediation.
| Economy | ||
|---|---|---|
| Estimates | Watonwan County | Minnesota |
| Population (2017 Annual Estimate) | 10,840 | 5,576,606 |
| Labor Force (9/2018) | 6,138 | 3,072,947 |
| Unemployment Rate (9/2018) | 2.4% | 2.2% |
| Household Income (2016) | $50,068 | $63,217 |
| Cost of Living Wage Requirement (Individual/No Children) | $12.85 | $15.22 |
| Cost of Living Wage Requirement (Average Family)* | $14.19 | $18.47 |
| Source: DEED Local Area Unemployment Statistics, DEED Cost of Living, U.S. Census, American Community Survey
*Average Family – 2 parents, 1 full-time/1 part-time, 1 child |
||
| Industry | |||||
|---|---|---|---|---|---|
| Total 2017 Employment | 2010-2017 Change | Average 2017 Annual Wages | 2010-2017 Change | ||
| Total, All Industries | 4,338 | 413 (10.5%) | $666 | $114 (20.7%) | |
| Manufacturing | 1,263 | 129 (11.4%) | $750 | $138 (22.5%) | |
| Health Care and Social Assistance | 449 | 4 (0.9%) | $724 | $130 (21.9%) | |
| Educational Services | 376 | 6 (1.6%) | $646 | $21 (3.4%) | |
| Public Administration | 347 | -1 (-0.3%) | $641 | $73 (12.9%) | |
| Transportation and Warehousing | 343 | 159 (86.4%) | $526 | -$60 (-10.2%) | |
| Source: DEED Quarterly Census of Employment and Wages | |||||

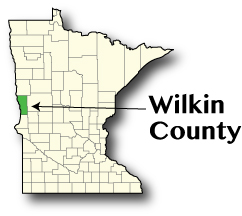
Wilkin County went through multiple name changes before being called Wilkin in 1868, named after Colonel Alexander Wilkin who, while not a Minnesota native, practiced law in the state and who also had served as a U.S. Marshall in the state. In 1858 the county was first named Toombs County after Robert Toombs, who served as a member of Congress as well as holding the title of U.S. senator before becoming a Confederate Secretary. However, in order to distance itself from the Confederacy, the county was renamed after President Andrew Johnson in 1863. The attempted impeachment of Andrew Johnson in 1868 gave the county its final name.
Wilkin County experienced a mild decrease in population of just over 800, leaving it ranked as the 78th most populous county in Minnesota. The labor force, meanwhile, saw an increase, albeit a rather minimal one, going from 3,698 participants in 2000 to 3,720 in 2017 – an increase of only 22 labor force participants (0.6 percent). However, the labor force hit a low of 3,484 in 2007 and a high of 3,822 in 2010. Over half (67.1 percent) of Wilkin County's residents leave the county for work while the county draws in 57.3 percent (1,272) of its workers from surrounding counties. The largest percentage of residents who leave the county for work commute to Richland County, North Dakota (34.8 percent), while an additional 7.8 percent (226 residents) go to Otter Tail County. Richland County, North Dakota, also sends in the most non-resident workers, sending 597 workers (26.9 percent) into the county followed by Otter Tail County which sends 261 (11.8 percent).
Of the total industries in Wilkin County, the top five make up almost 60 (59.3) percent of the estimated 1,875 jobs in 207 firms. Health Care and Social Assistance accounts for 23.3 percent of the total jobs in the county in 16 firms followed by Educational Services (222 jobs in four firms), Wholesale Trade (188 jobs in 13 firms), Retail Trade (142 jobs in 19 firms), and Public Administration (122 jobs in 13 firms).
Across all industries, Wilkin County saw job loss, falling from 2,113 in 2010 to 1,875 in 2017, a drop of 11.3 percent. The largest job gains were seen in Educational Services, up 37 jobs or 20 percent, and Manufacturing, which saw a jump of 177.8 percent by going from nine jobs in 2010 to 25 jobs in 2017. In contrast, Health Care and Social Assistance saw the largest decrease after losing 140 jobs since 2010, followed by Accommodation and Food Service which saw job decline of 85 jobs. Four other industry sectors saw job loss during this time, including Real Estate and Rental and Leasing and Public Administration, both of which saw a decline of one job, Finance and Insurance which lost five jobs, and Retail Trade which fell by 41 jobs.
| Economy | ||
|---|---|---|
| Estimates | Wilkin County | Minnesota |
| Population (2017 Annual Estimate) | 6,324 | 5,576,606 |
| Labor Force (9/2018) | 3,549 | 3,072,947 |
| Unemployment Rate (9/2018) | 2.4% | 2.2% |
| Household Income (2016) | $52,963 | $63,217 |
| Cost of Living Wage Requirement (Individual/No Children) | $12.73 | $15.22 |
| Cost of Living Wage Requirement (Average Family)* | $14.41 | $18.47 |
| Source: DEED Local Area Unemployment Statistics, DEED Cost of Living, U.S. Census, American Community Survey
*Average Family – 2 parents, 1 full-time/1 part-time, 1 child |
||
| Industry | |||||
|---|---|---|---|---|---|
| Total 2017 Employment | 2010-2017 Change | Average 2017 Annual Wages | 2010-2017 Change | ||
| Total, All Industries | 1,875 | -238 (-11.3%) | $765 | $198 (34.9%) | |
| Health Care and Social Assistance | 437 | -140 (-24.3%) | $737 | $239 (48.0%) | |
| Educational Services | 222 | 37 (20.0%) | $706 | -$10 (-1.4%) | |
| Wholesale Trade | 188 | 3 (1.6%) | $1,341 | $176 (15.1%) | |
| Retail Trade | 142 | -41 (-22.4%) | $525 | $113 (27.4%) | |
| Public Administration | 122 | -1 (-0.8%) | $815 | $148 (22.2%) | |
| Source: DEED Quarterly Census of Employment and Wages | |||||