by Dave Senf
January 2020
Note: All data except for Minnesota’s PMI have been seasonally adjusted. See the feature article in the Minnesota Employment Review, May 2010, for more information on the Minnesota Index.
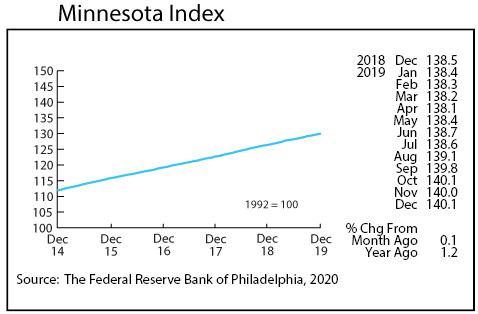
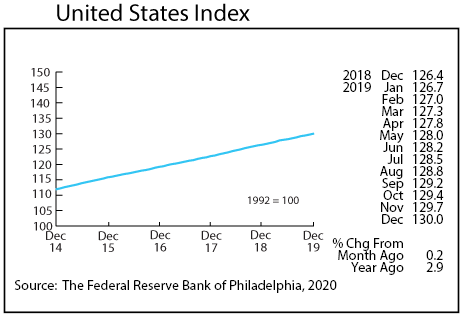
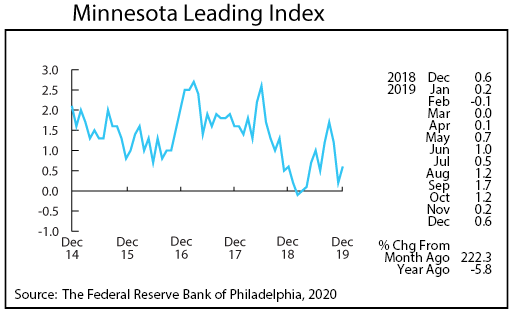
The Minnesota Index, after slipping 0.1 percent in November, inched up 0.1 percent in December. Minimal wage and salary employment growth, slipping average weekly manufacturing hours, and a flat unemployment rate added up to the small gain. The U.S. index increased 0.2 percent in December. Minnesota’s index, after outpacing the U.S. index from August through October, lagged the national index for the second straight month.
December’s reading was only 1.2 percent higher than a year ago for the second straight month while the U.S. annual increase was 2.9. Minnesota’s economy slowed noticeably over the last two months of the year. Minnesota finished in the bottom 10 when it comes to growth in state indices in 2019. The low ranking held for December 2018 to December 2019 growth and for annual average growth. The index will be revised in March, and Minnesota’s economic growth is expected to look somewhat better after revisions.
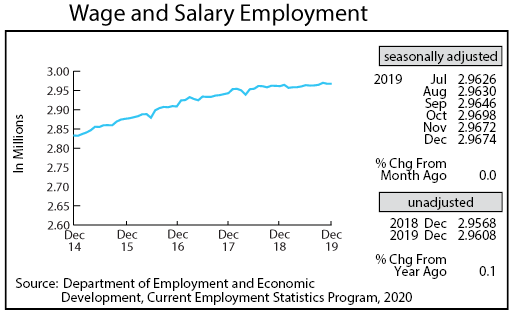
Adjusted Wage and Salary Employment was virtually unchanged in December with 200 jobs added. Employment dropped by 100 jobs in the private sector while increasing 300 jobs in the public sector. The goods-producing payroll dipped by 1,500 positions while the service-providing payroll climbed by 1,700 jobs. Educational and Health Services along with Manufacturing cut the most positions. Trade, Transportation, and Utilities, Other Services, and Leisure and Hospitality added the most positions.
Over-the-year job growth for December was 0.1 percent, the second lowest month during the year. U.S. job growth in December was up 1.4 percent from a year ago. Minnesota’s annual average job growth was 0.3 percent for 2019 before revisions due out in March. The rate is expected to be revised up slightly but still finish below the 0.7 percent growth in 2018.
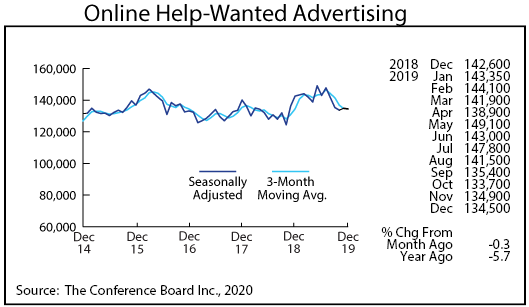
Online Help-Wanted Ads slipped 0.3 percent in December, declining for the fourth time over the last five months. Job postings rose 1.5 percent nationally. Job postings average 140,700 in 2019 which is 35 percent higher than the 15-year average of 103,000. This indicates that demand for workers remains high in Minnesota and that job growth has been curbed by the small pool of job seekers.
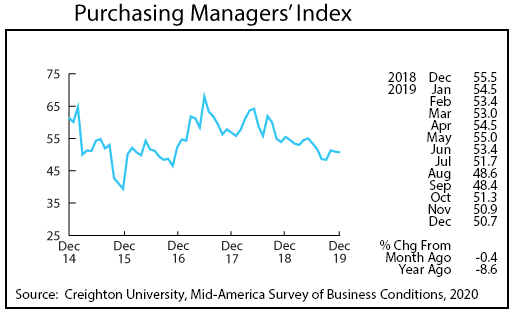
Minnesota’s Purchasing Managers’ Index (PMI) dipped for six of the last seven months in December, dropping to 50.7. The slightly above 50 reading suggest that Minnesota’s manufacturing sector is expanding but at a very slow pace. The Mid-America Business Index jumped to 50.6 while the Institute of Supply Management’s national PMI dropping to 47.2.
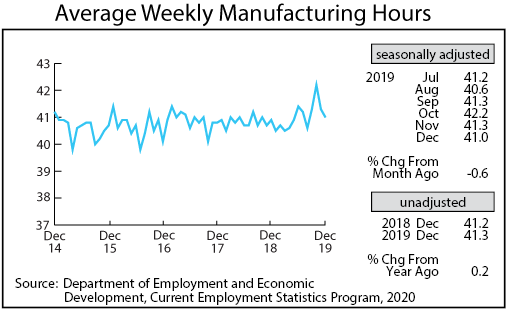
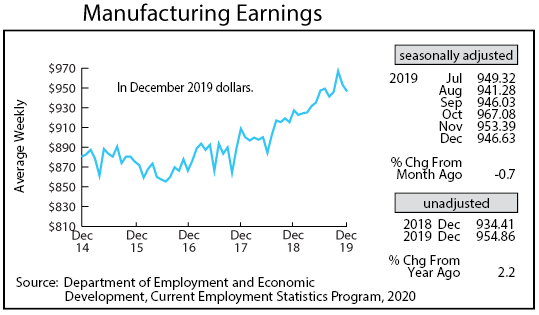
Adjusted average weekly Manufacturing Hours tailed off for the second straight month to 41.0. Average factory hours were up slightly in 2019 from 2018, 41.0 compared to 40.9 hours. Average weekly Manufacturing Earnings, adjusted for inflation and seasonality, fell for the second month in a row to $946.63 after hitting a record high in October. Real manufacturing earnings, adjusted for inflation and seasonally, were 3.8 percent over 2018 which is the strongest increase over the last nine years. The robust gain in real factory paychecks is consistent with companies’ having to increase pay in a very tight job market.
The Minnesota Leading Index, after dropping off sharply during the previous two months, reversed directions in December, inching up to 0.6. The 37-year monthly average is 1.4, so December’s reading indicates that economic growth in the state during the first half of 2020 will be roughly half as fast as the long-term average. The U.S. index was 1.5, suggesting that Minnesota’s economic growth during the first half of 2020 will be half as fast as the national pace.
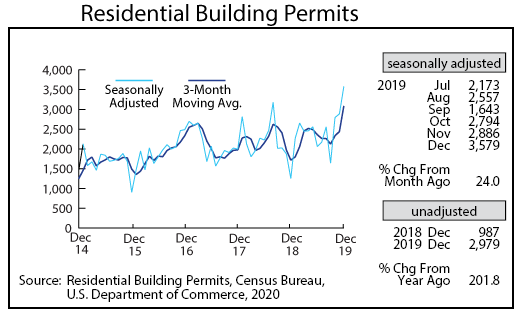
Residential Building Permits surged for the second time in three months, jumping to 3,579. That was the highest monthly total in over 14 years. Minnesota accounted for 2.2 percent of U.S. home-building permits in 2019. That is noticeably higher than Minnesota’s 1.7 percent of U.S. population. Home-building permits were 15.6 percent higher than in 2018 and had the highest annual total since 2005.
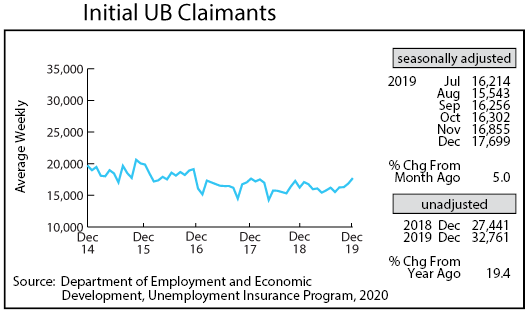
Seasonally Adjusted Initial Claims for Unemployment Benefits (UB) rose for the fourth consecutive month to 17,699 in December. That was 9 percent above last December’s level. The uptick in initial claims over the last few months pushed 2019 claims level 0.1 percent higher than in 2018. That broke a nine-year streak of falling annual claim totals. Claim levels remain low by historical standards, but the recent uptick should be watched.
