by Dave Senf
November 2017
Note: All data except for Minnesota’s PMI have been seasonally adjusted. See the feature article in the Minnesota Employment Review, May 2010, for more information on the Minnesota Index.
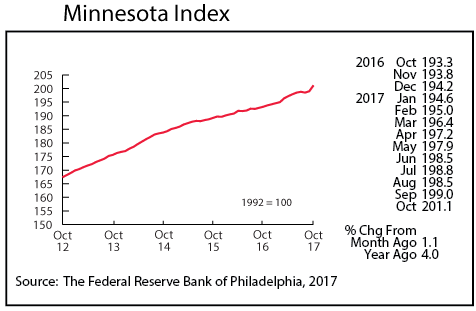
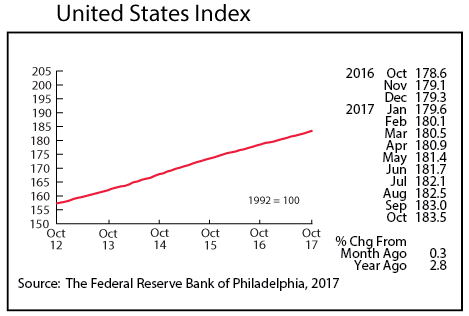
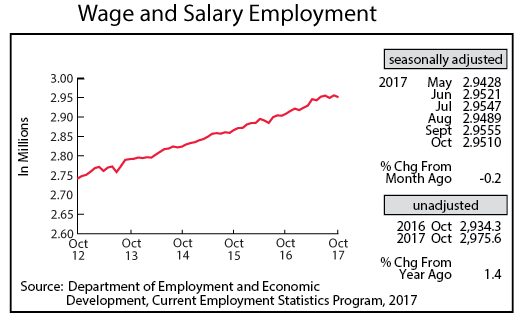
Minnesota’s adjusted Wage and Salary Employment declined by 4,500 jobs in October as private sector employers cut 5,000 positions while public sector employers added 500 positions. Job loss was highest in Educational and Health Services, Construction, and Trade, Transportation, and Utilities. Job expansion was highest in Manufacturing and Leisure and Hospitality.
Minnesota’s unadjusted over-the-year job growth was 1.4 percent for the second straight month. Unadjusted U.S. job growth was also 1.4 percent over the year. Minnesota’s annual average job growth has averaged 1.7 percent through October which is slightly higher than the U.S. 1.5 percent rate. Minnesota’s monthly job growth, on a year over year basis using unadjusted job numbers, has been faster than the U.S. growth rate 57.6 percent of the time with data going back to 1950.
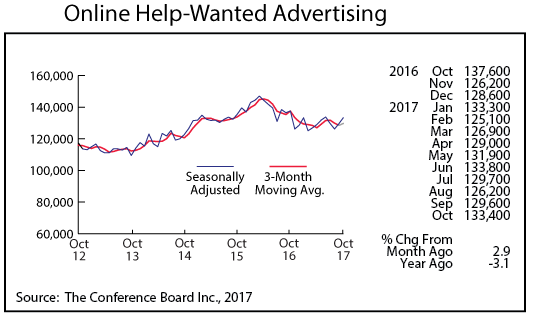
Online Help-Wanted Ads rose for the second consecutive month, climbing to 133,400. October’s 2.9 percent jump was a bit higher than the 1.8 percent increase nationwide. Online job postings for Minnesota have zigzagged between 137,000 and 125,000 over the past 12 months. Minnesota’s share of U.S. online job ads reached 2.9 percent over the last two months even though Minnesota’s share of national wage and salary employment is only 2.0 percent. Minnesota has 45 percent more online help-wanted ads proportionately than its share of employment.
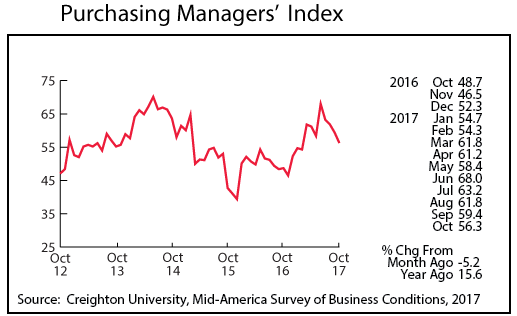
Minnesota’s Purchasing Managers’ Index (PMI), after reaching a five-year high in June, has been gradually retreating over the last four months. October’s reading slipped to a still healthy 56.3. The index has averaged 54.0 over its 23-year existence. A reading above 50 indicates expansion in Minnesota’s manufacturing sector while a reading below 50 suggests the sector is pulling back. The corresponding national index declined to 58.7 while the Mid-American index also advanced to 58.8. Manufacturing jobs in Minnesota and nationally have increased 1.2 percent since last October.
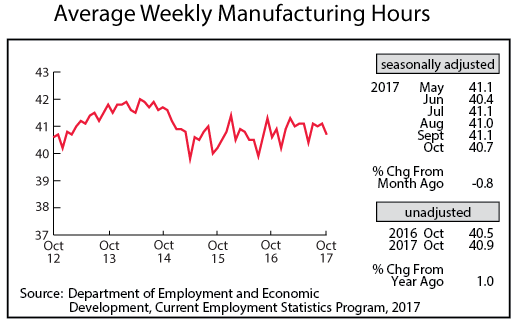
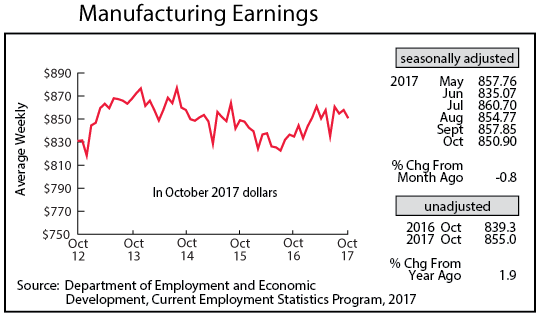
Adjusted Manufacturing Hours fell to 40.7 in October, the lowest level since June. Average weekly Manufacturing Earnings inched down to $850.90 but in real terms remain higher than a year ago. The factory paycheck, after accounting for inflation, has average 2.5 percent more than last year through October. In 2016 factory paychecks declined by 1.5 percent over the year. The pay raise that Minnesota manufacturing workers are getting in 2017 is another indicator that manufacturers in the state are rebounding from two lackluster years in 2015 and 2016. A weaker dollar and a stronger global economy have helped in the turnaround.
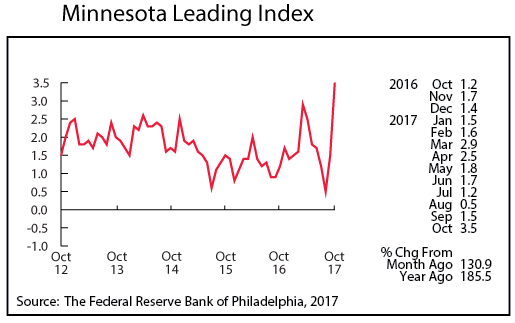
The Minnesota Leading Index skyrocketed through the roof in October, spiking to 3.5. That is the highest reading since September 2011 and more than double the 35-year monthly average of 1.5. Minnesota’s leading index has been higher than the U.S. leading index in eight months so far this year, indicating that Minnesota’s economy will be expanding faster than the U.S. over the next six months.
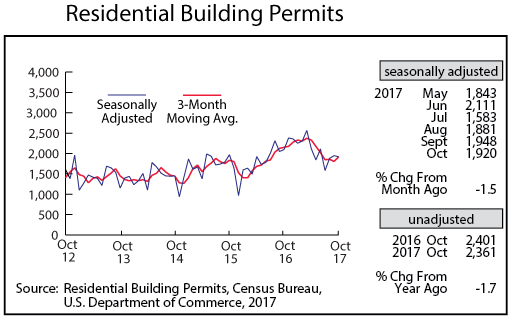
Adjusted Residential Building Permits dipped slightly to 1,920 in October. Monthly home-building permits have average only 1,899 during the last five months after having averaged 2,216 during the first five months of the year. What looked like a banner year for home-building earlier in the year now looks like a year of moderate growth for home-building when compared to last year. Home-building permits are up 10 percent from last year through October while construction employment is up 5 percent from a year ago.
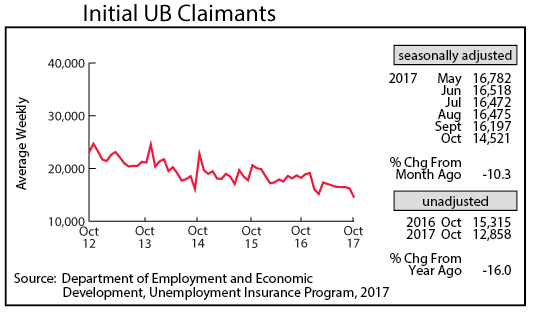
Adjusted Initial Claims for Unemployment Benefits (UB) tailed off to 14,521 in October, the lowest level since September 1999 when the unemployment rate was estimated to be 2.9 percent. The tight labor market has employers holding on to their workers as finding workers to hire has become a major struggle. Real wages, after stagnating for a decade or so, have begun to rise as the job market has turned and now favors workers.