by Mark Schultz
September 2020
Where would Minnesota be without employees who work tirelessly in construction, affording us stores and shopping centers to obtain the needs and wants that we have, residential dwellings we affectionately call home, and commercial buildings that offer services we need and desire? Specialty Trade Contractors are a subgroup of the broader Construction industry and provides 81,800 jobs at 10,829 employing firms in the State of Minnesota, making up 60.9% of the total Construction jobs in the state and 2.8% of the total jobs across all industries. Specialty Trade Contractors is made up of four subsectors, including Foundation, Structure and Building Exterior Contractors (14,974 jobs at 2,170 firms), Building Equipment Contractors (38,236 jobs at 3,494 establishments), Building Finishing Contractors (15,704 jobs at 2,541 firms), and Other Specialty Trade Contractors (12,885 jobs at 2,624 establishments) (see Table 1).
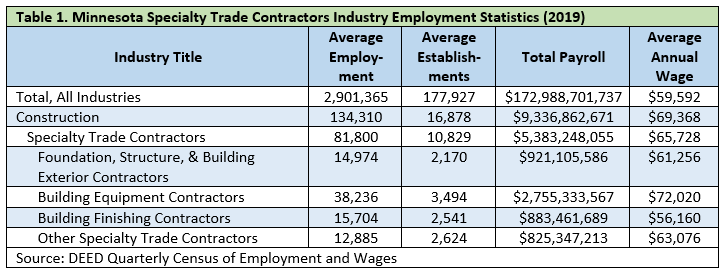
Also shown in Table 1, Specialty Trade Contractors makes up 57.7% of the total Construction payroll in the state. Average annual wages for Specialty Trade Contractors rest at $65,728, which is 5.2% below the average annual wage in the broader Construction industry, yet is 10.3% higher than the wages across all industries. Over the last 10 years the wages for Specialty Trade Contractors has risen $17,368, a bump of 35.9%. Comparatively, the wages in Construction rose by 32.3%, and those across all industries increased by 31.6%.
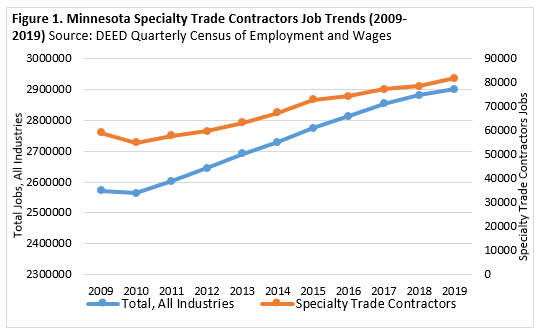
Both Specialty Trade Contractors and all industries saw a slight decline in jobs from 2009 to 2010, but have since both seen increases. However, the magnitude of those rises have been considerably different, with the number of jobs for Specialty Trade Contractors increasing by 38.2% compared to the 12.8% rise seen across all industries (see Figure 1).
Where might one go for their football equipment, some packs of Pokémon cards, the latest book by Stephen King, or the newly released Erasure album? While there is a good chance they might shop online for these items, let’s not forget they could go to one of the 945 Sporting Goods, Hobby, Book, and Music Stores in Minnesota. The Sporting Goods, Hobby, Book, and Music Stores industry supplies almost 11,150 jobs in the State of Minnesota and is part of the broader Retail Trade industry, making up 3.8% of the jobs in Retail Trade. This industry is made up of two subsectors, including Sporting Goods, Hobby, and Musical Instrument Stores (10,128 jobs at 848 firms), and Book, Periodical, and Music Stores (1,012 jobs at 97 establishments (see Table 2).

Also shown in Table 2, Sporting Goods, Hobby, Book, and Music Stores make up 3.8% of the total Retail Trade payroll in the state. Average annual wages for Sporting Goods, Hobby, Book, and Music Stores sit at $21,268, which is 32.3% lower than the average annual wage seen in the broader Retail Trade industry and 64.3% lower than the wages across all industries. Over the last 10 years the wages for Sporting Goods, Hobby, Book, and Music Stores has risen by $5,044, an increase of 31.1%. Comparatively, the wages in Retail Trade saw a bump of 30.7% and those across all industries increased by 31.6%.
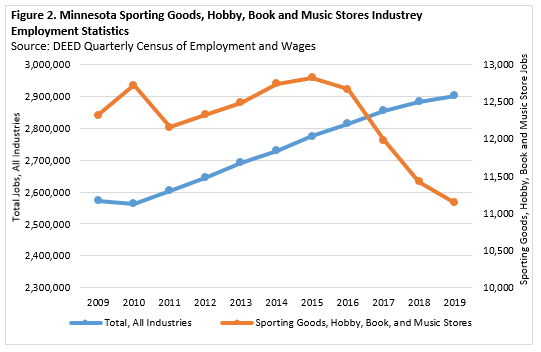
While the number of jobs across all industries saw an increase over the last 10 years, overall the number of jobs in Sporting Goods, Hobby, Book and Music Stores saw a decline, likely caused by an increase in online shopping. Since 2009, Sporting Goods, Hobby, Book and Music Store jobs decreased by 9.5%, compared to the 12.8% increase seen in the total jobs across all industries (see Figure 2).
Agriculture, Forestry, Fishing, and Hunting makes up only 0.8% of the total jobs in Minnesota; however, that small percentage does not negate the importance of this industry in the state. One subsector of this industry is Support Activities for Agriculture and Forestry, which makes up 11.6% of the total jobs in the broader Agriculture, Forestry, Fishing, and Hunting industry. There are 549 employing firms in Support Activities for Agriculture and Forestry, making up 19.1% of the total establishments in this subsector. This subsector is comprised of three separate areas, including Support Activities for Crop Production (1,663 jobs at 324 firms), Support Activities for Animal Production (822 jobs at 172 establishments), and Support Activities for Forestry (116 jobs at 53 firms) (see Table 3).

Total payroll for Support Activities for Agriculture and Forestry are also shown in Table 3. The total payroll in this subsector makes up 12.1% of the total payroll in Agriculture, Forestry, Fishing, and Hunting, with the largest contributor being Support Activities for Crop Production. Average annual wages in Support Activities for Agriculture and Forestry rest at $42,120, which is 4.1% higher than those seen in the broader Agriculture, Forestry, Fishing, and Hunting industry, yet is 29.3% lower than the annual wages seen across all industries. Over the last 10 years the wages in Support Activities for Agriculture and Forestry have increased by $10,088, a jump of 31.5%, which is lower than the 42.2% increase seen in the larger Agriculture, Forestry, Fishing, and Hunting sector and just under the 31.6% growth seen across all industries.
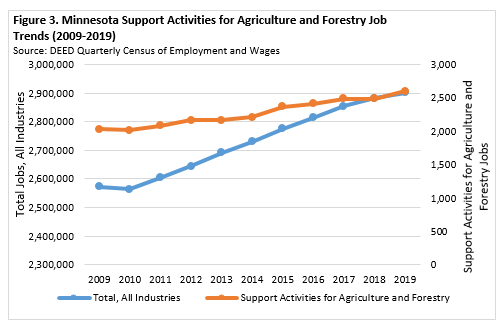
Overall, both the number of jobs across all industries and that in Support Activities for Agriculture and Forestry have seen growth over the last decade. However, the magnitude of that growth has been much higher for Support Activities for Agriculture and Forestry, which showed a 28.4% increase from 2009 to 2019, equaling 575 more jobs. Comparatively, the number of jobs across all industries bumped up by only 12.8% during this time frame (see Figure 3).
Over land, air, and water, the Transportation industry provides a host of avenues which allows consumers to travel all over the globe, get rides from services such as taxis or a tow when their car breaks down, go sightseeing, and have the opportunity to purchase goods that have been transported and delivered to stores by trucks, just to name a handful. But, where would the Transportation industry be without the support activities that go hand in hand with transportation? Support Activities for Transportation makes up 8.1% of the total jobs in the broader Transportation and Warehousing industry and are spread across 631 employing firms. This subsector is made up of six job areas, including Support Activities for Air, Rail, Water, and Road Transportation, as well as Freight and Transportation Arrangement and Other Support Activities for Transportation (see Table 4).
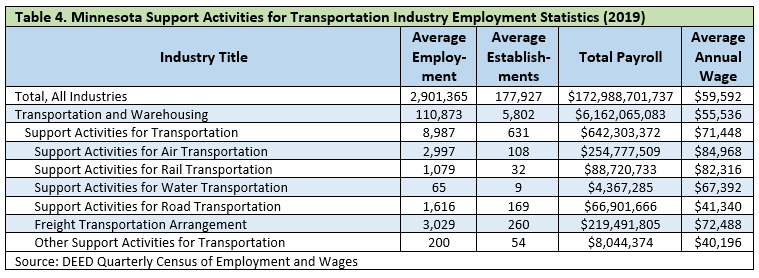
Also shown in Table 4 is the total payroll in Support Activities for Transportation, which makes up 9.6% of the total payroll in the larger Transportation and Warehousing industry. Average annual wages in Support Activities for Transportation sit at $71,448. The wages, however, range from $40,195 in Other Support Activities for Transportation to $84,968 in Support Activities for Air Transportation. The average annual wages in Support Activities for Transportation are 28.7% higher than those seen in Transportation and Warehousing and 19.9% higher than those seen across all industries. Over the last decade the wages in Support Activities for Transportation have increased by 27.5%, compared to 24.6% seen in Transportation and Warehousing and 31.6% see across all industries.
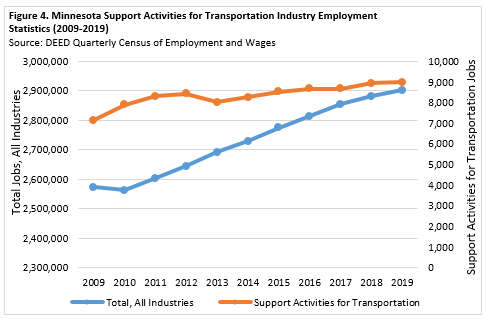
Both Support Activities for Transportation and the total number of jobs across all industries saw an increase over the last 10 years. Support Activities for Transportation increased by 1,845 jobs, an increase of 25.8% while the jobs across all industries increased by 12.8% from 2009 to 2019 (see Figure 4).
