
by Alessia Leibert
March 2023
Coming out of the Pandemic Recession, the Minnesota labor market is facing two major challenges. First, price inflation is outpacing wage growth, hurting workers by eroding their real earnings. Second, historically high voluntary quit rates1 are hurting firms while they are already struggling to fill job openings.
This analysis looks at Minnesotans who were employed in third quarter 2021 to see if they changed their primary employer within one year. Specifically, the study addresses the following questions:
We define job mobility as a change in employer2 in the worker's dominant job3 between the baseline quarter and the same quarter one year later. Workers are categorized into three job mobility groups. The first group, labeled Stayers, consists of workers with jobs in both time periods who remained with the same employer. The second group, labeled Switchers, consists of workers who had jobs in both time periods but changed employer, either voluntarily or involuntarily. The third group, labeled Leavers, consists of workers who were employed in the third quarter of 2021 but were not employed in the third quarter of 2022. Leavers4 are not necessarily permanent workforce dropouts: they may return to work later.
Table 1 documents the relative size of each group, comparing the period from third quarter 2018 to third quarter 2019 (pre-Pandemic Recession) to the period from third quarter 2021 to third quarter 2022 (post-Pandemic Recession and most recent year of data available). Comparing the three categories over time allows us to gauge how job mobility has changed after the Pandemic Recession.
Table 1: Job Mobility Shares Pre and Post Pandemic Recession
| Job Mobility Group | Pre-Pandemic Recession Cohort (q3 2018 to q3 2019) | Post-Pandemic Recession Cohort (q3 2021 to q3 2022) |
|---|---|---|
| STAYERS: Employed with the same employer | 72.8% | 70.8% |
| SWITCHERS: Changed employer | 18.5% | 19.2% |
| LEAVERS: Not employed in end quarter | 8.7% | 10.1% |
| TOTAL, age 18-70* | 2,489,569 | 2,362,838 |
| *The conditions for inclusion in the study are having information on date of birth, with age between 18 and 70, and earning at least $50 a quarter. This represented 85% of individuals in UI wage records.
Source: Minnesota UI wage records and drivers' license records from the Minnesota Department of Motor Vehicles. |
||
The share of Stayers dropped by two percentage points, from 72.8 to 70.8, indicating that more people quit their employer in the post-Pandemic Recession labor market compared to a comparable period immediately preceding the pandemic outbreak. This decline in employer loyalty, widely called the "Great Resignation", is actually rather small. The distinction between workers who quit their jobs to take other jobs and workers who leave the workforce is also important: a reallocation of workers across employers can spark competition on wages which can motivate people to continue to work, while workers resigning without taking other jobs can cause workforce shortages.
The next step in our analysis consists in breaking down these results by workers' age (Figure 1). Stayers are represented with the color blue, Switchers with green, and Leavers with yellow. The most likely to leave their employer are workers in the 18-25 age group, with stay rates at 47% and switch rates at 39%. This group also has a high rate of Leavers (15%), resulting from their high geographic mobility: since the youngest workers are the most likely to leave Minnesota for another job or educational opportunity, they are relatively more likely to disappear from Minnesota payroll records.
Figure 1
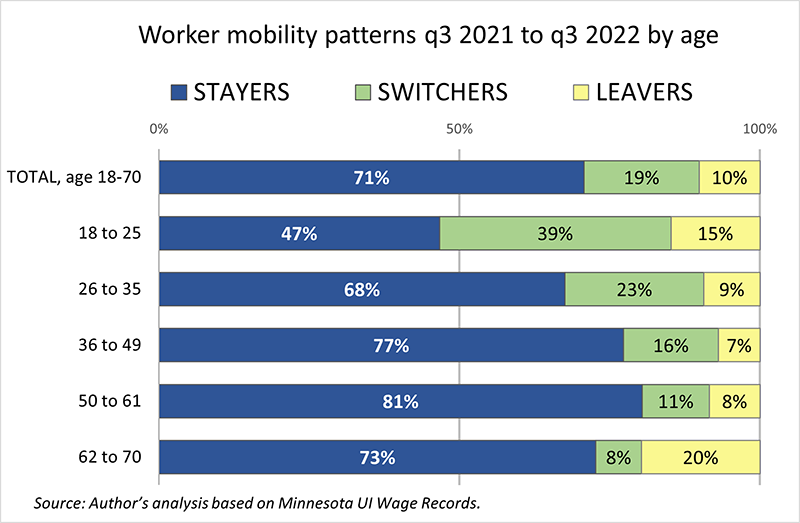
At the opposite end of the age spectrum, the 62 to 70 age group had the highest rate of Leavers: 20%, or one out of five workers. This rate is higher than it was pre-Pandemic, indicating that the pandemic triggered an acceleration in retirements.
Women were also more likely to switch employer than men, 20% versus 18%. Not surprisingly, the most severe hiring and retention difficulties in Minnesota are currently in female-dominated occupations such as nursing assistants, personal care aides, teachers, childcare workers, and mental health professionals.
There are many forces underlying the Great Resignation. Some have to do with characteristics of workers, as we've seen already. Others have to do with the characteristics of jobs and the abundance of alternatives in today's tight labor market.
The main job characteristic associated with the likelihood of quitting is compensation. The lower the wage, the less likely it was for workers to remain with the same employer (Figure 2). The four wage groups are based on quartiles5: the first quartile corresponds to the 25th percentile and below.
Figure 2
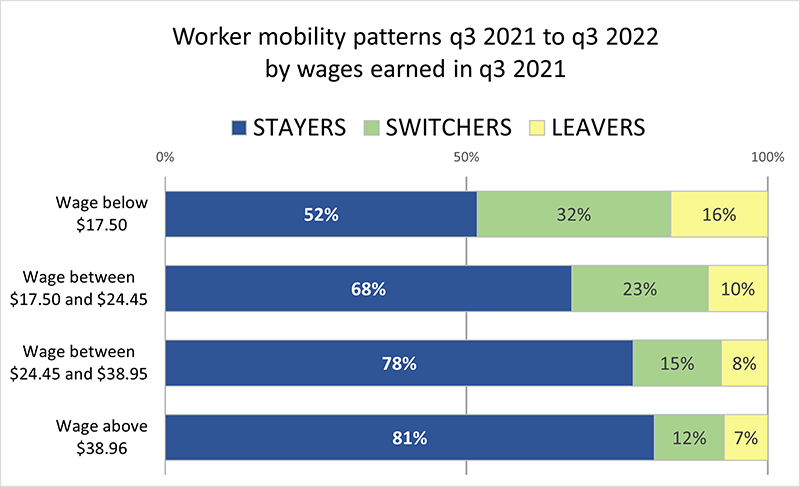
Workers in jobs that paid more than $38.96 were by far the least likely to move to a different employer (only 12% of them did so) and the least likely to leave (only 7% did so).
Since the plurality (34%) of jobs held by Switchers and Leavers combined paid less than $17.50, we can conclude that the Great Resignation is being fueled primarily by low-wage workers.
Besides wages, Switchers and Leavers were more likely to quit jobs with the following characteristics:
These results suggest that the decision to quit is influenced by economic and job quality considerations, and that Leavers might represent a bigger problem for employers due to the higher costs of training new hires for tasks performed by more seasoned employees.
A key factor determining which workers will switch employer is firm size. Employers in large and very large firms have been more successful at retaining workers than smaller firms (see Figure 3).
Figure 3
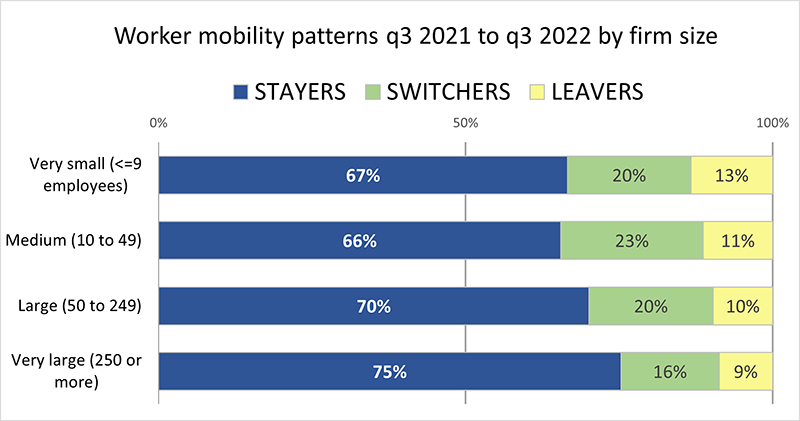
What's the reason for such differences in retention? Larger firms have higher profitability, thus higher capacity to invest in employee retention in the form of higher wages and bonuses. Large size also means more opportunities for internal job mobility through career ladders, which fuel wage growth. Last but not least, large firms are more likely to offer fulltime employment with perks such as retirement benefits, remote work options, training and professional development, all of which can entice employees to stick around longer. Firms that cannot offer these opportunities, including many small firms, are at a disadvantage in terms of retention.
Worker tendency toward mobility also varies by industry. Figure 4 reveals stark differences in the share of Stayers, ranging from 82% in Public Administration to 25% in Temp Help.
Figure 4
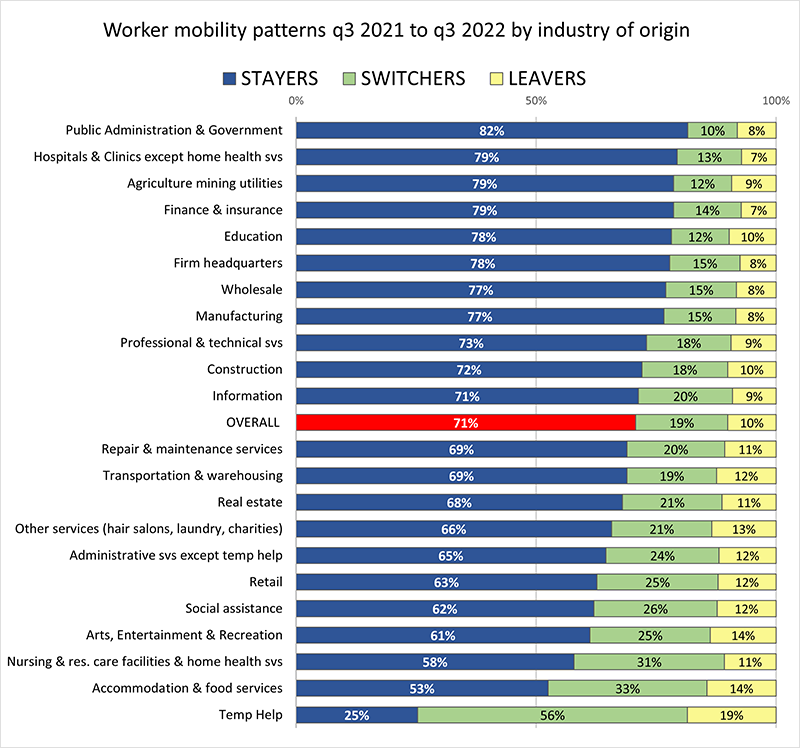
These results are correlated with firm size. The sectors topping the list, especially Public Administration and Hospitals, tend to have higher average firm size and higher levels of unionization. Workers remain longer with their employer in industries that offer relatively more job stability, more bargaining power (often thanks to unions), and career advancement opportunities tied to tenure, with larger firms providing more such opportunities than smaller firms. In contrast, the sectors at the bottom tend to have smaller average firm size and lower levels of unionization6.
Not surprisingly, the three of four sectors at the very bottom of the list- Temp Help, Accommodation & Food Services, Arts entertainment & Recreation - offer mostly temporary, part-time and/or low-wage jobs. They tend to have a more transient workforce, such as college-age students. In these sectors, job mobility is largely a function of turnover: workers leave to pursue more permanent forms of employment, often in different industries.
However, retention challenges are not limited to industries with small average firm size and predominantly part-time workers. Industries with medium- and large sized employers, such as Nursing & Residential Care Facilities and Social Assistance, are also facing severe retention challenges. One likely reason for the high shares of Switchers in these sectors (31% and 26% respectively) is that wage growth is constrained by structural factors7, making retention more difficult.
Where did Switchers go? Sectors that absorbed the most Switchers from other sectors are Manufacturing (10%), Retail (9%), Professional & Technical Services (7%), Hospitals & Clinics except Home Health Services (7%), and Accommodation & Food Services (7%). These sectors were able to attract the most workers thanks to larger than average firm size in the sector and an acceleration in job growth post-pandemic leading to rapid increases in wage offers for new hires as a way of attracting candidates8.
Finally, a firm's geographic location also affects retention. Employers in the Twin Cities Metro face the highest risk of losing their employees to competitors, with retention rates at 70% and switch rates at 20%. Thanks to record-high job vacancies, workers in the Metro have better chances than other Minnesotans to find an employer in their area that can offer higher wages or more favorable work conditions.
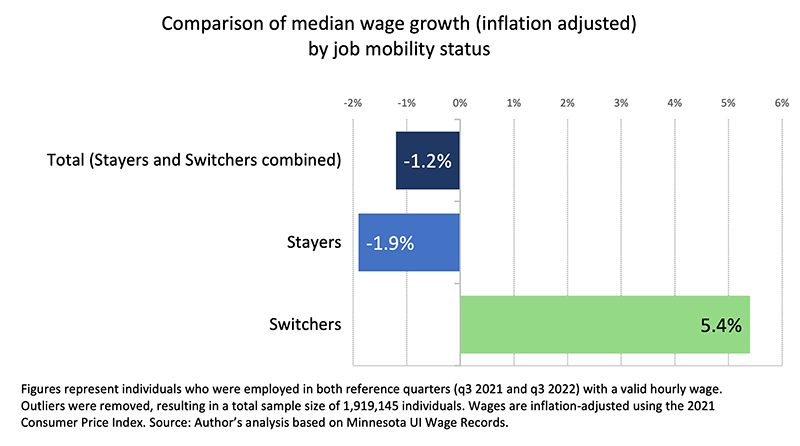
The post-Pandemic Recession labor market is characterized by high levels of inflation that have eroded earnings. When we adjust wages for inflation (see Figure 5) we find that median wage growth9 over the year was negative: -1.2%. Breaking down this result by job mobility categories reveals that real wages for workers who remained with their employer shrunk by -1.9%. This result means that half of these Minnesotans experienced a wage cut greater than -1.9%. In contrast, those who switched employer saw a median wage growth of 5.4%, suggesting that the decision to move had a strong economic rationale.
Figure 5
When workers find better paid jobs they will either quit their current job or renegotiate their wage, benefits, and work conditions. Initially employers might be reluctant to renegotiate and may not be able to offer pay raises to offset inflation; they might decide to adjust upwards only the wages of their new hires, as a way of easing hiring difficulties. However, large disparities between wages for new hires and wages for incumbents become unsustainable over time, especially in jobs requiring low skills like food preparation. Low-skilled jobs are very similar across firms, allowing workers to compare their pay rates with those of competitors. This comparison facilitates job shopping, pushing more workers to change employer for an identical but better paid job.
Over time these dynamics will push employers to align the wages of their workers to their competitors, benefiting low-wage workers overall. This is good news for wage equality. However, not all workers in jobs that pay below the median (or the "typical" hourly wage) were able to take advantage of job shopping. Figure 6 examines the relationship between age, earnings level and wage growth from switching. We distinguish between four earnings levels, called quartiles, which are different in each age category. Workers in the first tier of the wage distribution (or first quartile) have higher green bars than any other, demonstrating that switching disproportionately benefited low-wage workers.
Figure 6
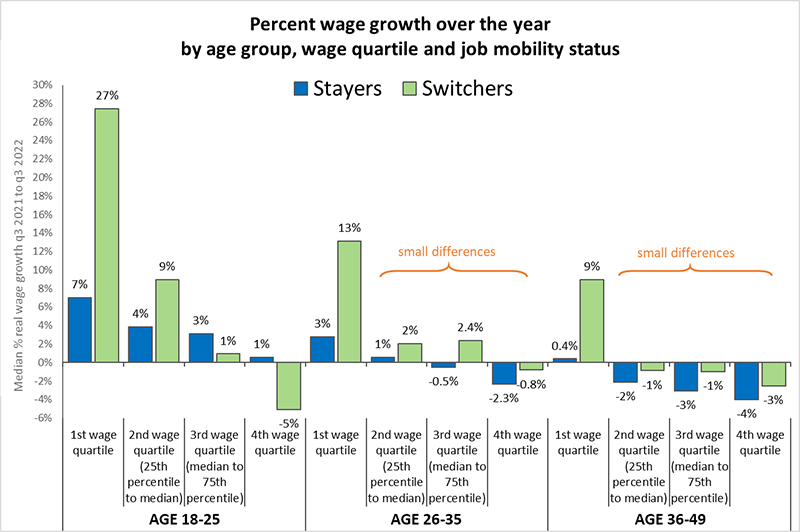
Switching always pays off more than staying at every age and earnings level, except in the two top quartiles of the 18 to 25 age range10. The largest payoffs were found among Switchers younger than 25 with earnings in the first quartile, whose wages grew by a stellar 27%. This increase may not be driven solely by switching employer, but by the rapid accumulation of work experience and changes in education common at this age. For example, a college student nearing graduation could transition from a job as a waitress to a job as a Registered Nurse in the span of a year, experiencing a huge bump in pay.
Workers in other wage categories and older than 25 face a dilemma: the change in wage from switching is not significantly better than the change in wage from staying. Small differences between the blue and the green bars make job mobility less profitable. Workers over age 49, not shown in Figure 6 for reasons of space, have even smaller differences between the blue and the green bars, indicating questionable benefits from switching. Older workers are the most penalized: they are squeezed between wage erosion when they stay and smaller wage erosion when they switch. In conclusion, the tight labor market is lifting some boats but not all boats.
The Great Resignation is neither as big nor as damaging as the name suggests. Compared to the pre-pandemic period, over-the-year job mobility increased only by two percentage points, with nearly half of the increase being driven by workers who are still in the workforce but changed employer. Key findings are summarized below:
In conclusion, the combination of a tight labor market and inflation is creating winners and losers. With job vacancies at a historic high and wages in low-paying jobs increasing faster than others, the lowest paid workers are finally seeing an opportunity for upward economic mobility. At the same time, the heightened competition for workers who are taking advantage of job shopping disproportionately benefits employers who are able to respond quickly, either by raising wages across the firm or by investing in other employee retention strategies.
1In Minnesota, voluntary quit rates in May 2022 were 26 percent higher than in May 2019. Source: U.S. Bureau of Labor Statistics quits rates data, non-seasonally adjusted
2By firm we mean an employer account, not its individual establishment. A worker who changed jobs from one location of a restaurant to a different location of the same restaurant, or from a manufacturing branch to a wholesale branch of the same firm does not qualify as job mobility in our study.
3Dominant job is defined as the job with the highest quarterly wages.
4Workers who took a job outside of Minnesota or became self-employed also fall into this category since this analysis is based on Minnesota U.I. covered employment data only.
5Source: OEWS survey 2022
6Such as family-owned restaurants, local sports clubs, and neighborhood retail shops.
7These structural factors affect particularly nursing homes and child care centers. In nursing homes, the ability to set employees' wages and benefits is constrained by state Medicaid reimbursement rates, which are significantly lower than Medicare and private-pay rates and often below the actual costs of care provided (see BDO Seidman. A Report on Shortfalls in Medicaid Funding for Nursing Home Care. BDO Seidman; 2007). Nursing homes are essentially competing with Accommodation & Food services and other low-wage service sectors for their direct-care staff. In the case of child care centers and other Social Assistance employers, the ability to raise wages is constrained by the fact that low-income customers are subsidized by government funding which falls short of the cost of service and doesn't cover all customers that would qualify.
8According to the most recent round of the Minnesota Job Vacancy survey, wage offers for new hires increased in 14 of the 20 main industries from 2020 to 2021. Some of the biggest increases occurred in Accommodation & Food Services (22%) and 11.8% in Retail Trade (11.8%).
9Median wage growth in this study represents the median hourly wage growth among workers who were employed in third quarter 2021 and again in third quarter 2022 with valid hourly wages at both points.
10These cases likely represent people who enrolled in college in Fall 2022 and entered part-time jobs paying less than what they were making in Fall 2021. The high volatility in wage growth in this age group is driven by the frequent back-and-forth between school and work.