by Dave Senf
January 2013
Note: All data except for Minnesota's PMI have been seasonally adjusted. See the feature article in the Minnesota Employment Review, May 2010, for more information on the Minnesota Index.
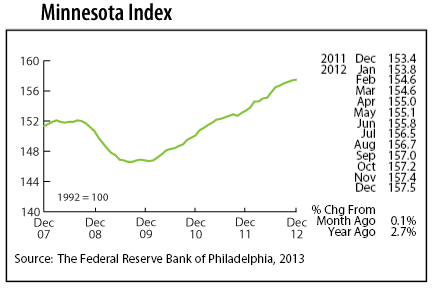
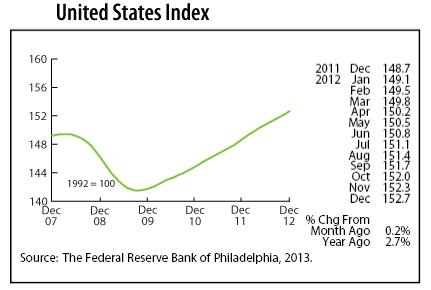
The Minnesota Index finished off the year by rising 0.1 percent in December. Climbing payroll employment and another drop in the state's unemployment rate propelled the index to its 14th consecutive increase. The U.S. index climbed for the 38th straight month, advancing 0.2 percent.
Minnesota's economy as measured by the Minnesota Index expanded 2.7 percent from December 2011 to December 2012, matching the U.S. growth rate. Last year's economic growth was a couple of steps faster than the 2.3 and 2.2 percent growth achieved in 2010 and 2011. The Minnesota Index has increased 7.5 percent since bottoming out in August 2009. The U.S. index is up 7.9 percent after turning the corner in October 2009.
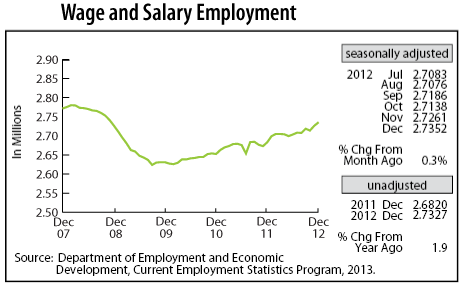
Minnesota employers continued to add workers at a robust pace in December as Wage and Salary Employment increased by 9,100 jobs. Job growth was broad with eight sectors increasing payroll totals. Hiring was robust in trade, transportation, and utilities and in professional and business services. The only negative job news in December was the loss of 3,500 construction jobs, the most construction jobs lost in the months since May 2010.
Minnesota's over-the-year job growth, based on unadjusted job numbers, was 1.9 percent in December, leaving annual average job growth at 1.3 percent for 2012. That 1.3 percent will be revised upward to around 1.7 percent when job data is benchmarked in February. The 1.7 percent annual gain equals the national rate and is the strongest since 2000. The state added 35,000 jobs in 2011 and 47,000 jobs in 2012 on an annual average basis.
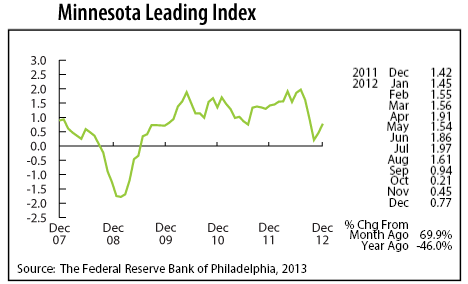
The Minnesota Leading Index climbed for the second straight month after having plunged from August through October. The deep drop, like the PMI decline, may have just been reflecting a pullback in Minnesota's manufacturing sector. Much of the decline may disappear when the index is revised to include benchmarked employment figures. Minnesota's economy looks to be headed for six more months of economic growth during the first half of 2013 based on the uptick in the leading index.
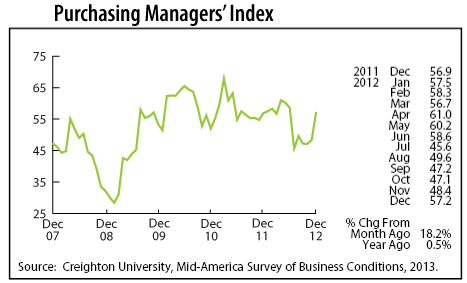
After five months of readings way below the growth-neutral level of 50, Minnesota's Purchasing Managers' Index (PMI) shot up in December to 57.2. December's spike was the 13th highest monthly increase over the index's 18 years of data. The index had been signaling since August that Minnesota's economy would be slowing down during the second half of 2012 and first half of 2013. The second half slowdown didn't materialize based on the strong job growth in November and December. Minnesota's manufacturers may have hit a soft patch in recent months, but other sectors of the state's economy are making up for slower manufacturing activity.
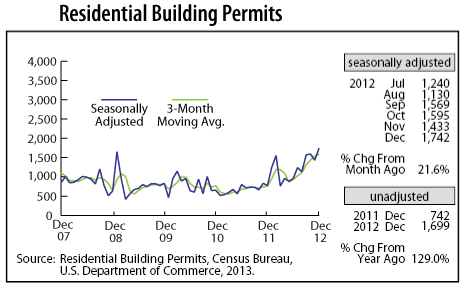
Adjusted Residential Building Permits reversed direction in December, rising to 1,742, the highest total in over six years. A large share of the building permits was for apartments. Minnesota accounted for 1.6 percent of the U.S. single-unit permits and 4.2 percent of nationwide apartment permits.
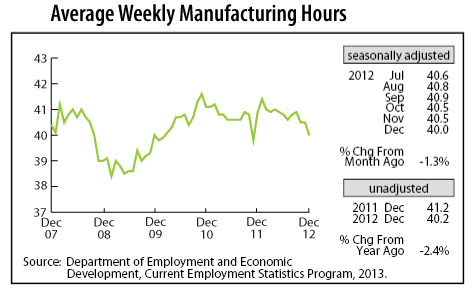
December's plunge in adjusted Manufacturing Hours is further evidence that Minnesota's manufacturers have downshifted over the last few months. Factory hours declined to 40.0 hours -- the shortest workweek in more than a year.
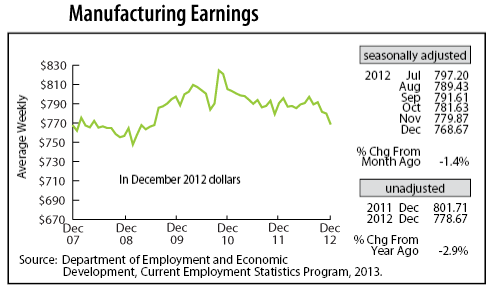
Adjusted Manufacturing Earnings stumbled for the third consecutive month, slipping to $768.67. The average factory paycheck adjusted for inflation hasn't been this skinny since June 2009. Shrinking factory paychecks are inconsistent with the perception that manufacturers are having trouble finding qualified employees. Shortages usually lead to wages going up, not down.
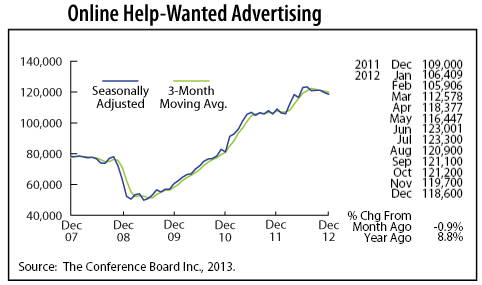
Minnesota's adjusted online Help-Wanted Ads dipped for the second month in a row but continued to run at a level consistent with job growth between 1.5 and 1.7 percent. The state's share of national online job advertising, as measured by the Conference Board, slipped to 2.4 percent which is still well above Minnesota's 2.0 percent share of the nation's payroll employment. Labor demand as measured by online job advertising was 14 percent higher in 2012 than in 2011 on an average annual basis. Job growth was up 30 percent last year meaning that the pace of job layoffs was considerably lower, and employers overcame the skills mismatch problem and found qualified workers.
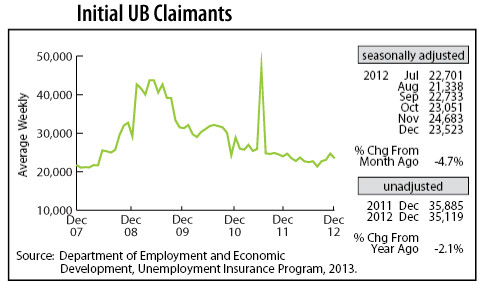
After drifting upward over the previous three months, adjusted Initial Claims for Unemployment Benefits (UB) tailed off in December. Total initial claims for 2012 were the lowest since 2007 and the third lowest since the start of the new century.