by Bettsy Hjelseth
June 2017

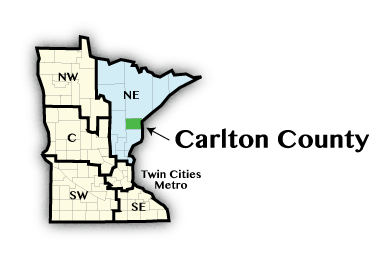
Carlton County was established in 1857. A major fire swept through the area in 1918, killing 453 people, displacing 11,238 families, and destroying 1,500 square miles of land.1
Carlton County will likely continue to be a major tourist attraction with its abundance of lakes, park trails, state forests, and other tourist sites. However, these jobs tend to be lower paying and part time. Development projects are underway throughout the county and are expected to expand jobs in tourism.2
| Economy | ||
|---|---|---|
| 2017 Indicators | Carlton County | Minnesota |
| Population (July 2016) | 35,738 | 5,519,952 |
| Labor Force | 17,488 | 3,019,047 |
| Average Unemployment | 5.5% | 3.7% |
| Average Annual Income (2016) | $41,444 | $54,288 |
| Cost of Living, Single Person | $26,073 | $29,856 |
| Cost of Living, two working parents + two children | $62,387 | $81,504 |
| Source: DEED Cost of Living in Minnesota 2017; DEED LAUS April 2017; U.S. Census Bureau, 2016 ACS, QCEW 2016 | ||
| Industry | |||||
|---|---|---|---|---|---|
| Carlton | Top Industries of Employment 2015 | Total 2015 Employment | Percent Change 2006-2015 | 2015 Average Annual Wages | Percent Change 2006-2015 |
| - | Total, All Industries | 13,540 | 3.0% | $39,838. | 27.1% |
| 1 | Education and Health Services | 3,717 | 15.4% | $40,200 | 23.4% |
| 2 | Trade, Transportation, and Utilities | 2,186 | -7.3% | $30,499 | 15.5% |
| 3 | Leisure and Hospitality | 1,985 | 11.9% | $18,414 | 40.0% |
| 4 | Manufacturing | 1,481 | -15.0% | $63,942 | 28.1% |
| Source: DEED Quarterly Census of Employment and Wages 2006-2015 | |||||
The expansion of Leisure and Hospitality jobs and the drop in Manufacturing jobs show jobs increasing in a low paying sector and decreasing in a high paying sector. Education and Health Services jobs will be steady as children continue to need education and the population ages. Manufacturing jobs are by far the highest paying jobs in the county, but they will likely continue to decrease as new technology increases, leading to improved productivity.
1Helberg, Davis. "The 1918 Fire: Cloquet in Ashes." Esko History, Sept. 2, 2010.
2"Land Development." Carlton County, Minnesota.

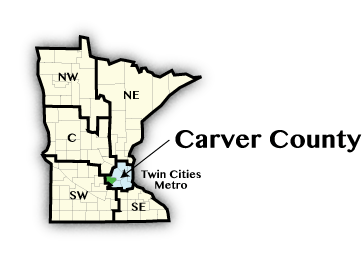
The Minnesota Territorial Legislature organized Carver County in 1855. The county was named after Jonathan Carver, an early explorer. In the mid-19th century, immigrants from Germany and Sweden settled in the area as crop or dairy farmers, but some worked in the brick industry.1
Farming is no longer as prominent in Carver County, as measured by employment, as it once was. Manufacturing has remained the leading industry in terms of employment in the last 15 years. In 2000 the industry had 34.2 percent of the total employment in the county. In 2015 the industry employed 25.6 percent of the total workforce and is expected to remain the largest industry.
| Economy | ||
|---|---|---|
| 2017 Indicators | Carver County | Minnesota |
| Population (July 2016) | 100,292 | 5,519,952 |
| Labor Force | 55,855 | 3,019,047 |
| Average Unemployment | 3.1% | 3.7% |
| Average Annual Income (2016) | $51,064 | $54,288 |
| Cost of Living, Single Person | $32,213 | $29,856 |
| Cost of Living, two working parents + two children | $91,402 | $81,504 |
| Source: DEED Cost of Living in Minnesota 2017; DEED LAUS April 2017; U.S. Census Bureau, 2016 ACS, QCEW 2016 | ||
| Industry | |||||
|---|---|---|---|---|---|
| Carver | Top Industries of Employment 2015 | Total 2015 Employment | Percent Change 2006-2015 | 2015 Average Annual Wages | Percent Change 2006-2015 |
| - | Total, All Industries | 37,509 | 12.2% | $52,223 | 29.1% |
| 1 | Manufacturing | 9,606 | -3.7% | $65,645 | 23.6% |
| 2 | Education and Health Services | 8,663 | 34.4% | $45,683 | 20.2% |
| 3 | Trade, Transportation, and Utilities | 5,349 | 10.7% | $42,503 | 12.9% |
| 4 | Professional and Business Services | 4,129 | 30.0% | $82,027 | 114.3% |
| Source: DEED Quarterly Census of Employment and Wages 2006-2015 | |||||
Professional and Business Services grew by far the fastest in Carver County from 2006 to 2015. The fastest growing industries within this category are Advertising and Related Services (319 jobs to 874 jobs) and Management of Companies and Enterprises (217 jobs to 1064 jobs). These industries saw their wages rise from $34,424 to $55068 and $65,000 to $155,532, respectively.
1"History Topics." Carver County Historical Society, 2017.

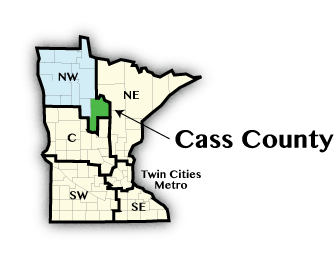
Cass County was created in 1851 and organized in 1897.1 The county was named after Lewis Cass who, with Henry Schoolcroft, discovered the source of the Mississippi River in 1820.2
Tourism is a major industry in Cass County with numerous family resorts, museums, and places to hike, camp, and shop. The county contains Leech Lake, the third largest lake in Minnesota, popular for fishing and water activities. Tourism is expected to remain a significant industry in the future.
| Economy | ||
|---|---|---|
| 2017 Indicators | Cass County | Minnesota |
| Population (July 2016) | 28,993 | 5,519,952 |
| Labor Force | 14,124 | 3,019,047 |
| Average Unemployment | 6.2% | 3.7% |
| Average Annual Income (2016) | $30,628 | $54,288 |
| Cost of Living, Single Person | $27,296 | $29,856 |
| Cost of Living, two working parents + two children | $62,366 | $81,504 |
| Source: DEED Cost of Living in Minnesota 2017; DEED LAUS April 2017; U.S. Census Bureau, 2016 ACS, QCEW 2016 | ||
| Industry | |||||
|---|---|---|---|---|---|
| Cass | Top Industries of Employment 2015 | Total 2015 Employment | Percent Change 2006-2015 | 2015 Average Annual Wages | Percent Change 2006-2015 |
| - | Total, All Industries | 9,929 | 2.8% | $29,008 | 21.2% |
| 1 | Leisure and Hospitality | 2,598 | -7.7% | $19,713 | 16.8% |
| 2 | Education and Health Services | 2,156 | 20.2% | $32,963 | 14.9% |
| 3 | Public Administration | 1,815 | 27.5% | $34,947 | 3.4% |
| 4 | Trade, Transportation, and Utilities | 1,236 | -13.4% | $24,608 | 16.7% |
| Source: DEED Quarterly Census of Employment and Wages 2006-2015 | |||||
Public Administration, including the government of the Leech Lake Band of Ojibwe, is the fastest growing industry in Cass County. Public Administration wage increases have lagged behind wage increases in other industries over the last decade but the average wage in the industry was still 20 percent higher than the overall county average wage in 2015.
1Ferguson, Joseph. "Cass County, Minnesota." eReference Desk, 2017.
2"Leech Lake History." Leech Lake Tourism Bureau, 2015.

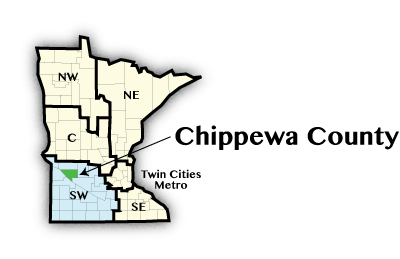
Chippewa County was established in 1862 and organized in 1868. It was named after the Chippewa River, a tributary of the Minnesota River.1 Fur trading was the major industry in the area in the early 1800s.2
Chippewa County employs the most people, about a quarter of their workforce, in the Education and Health Services industry. Manufacturing jobs will likely continue to make up the higher paying jobs in the county, but those jobs will likely continue to decrease.
| Economy | ||
|---|---|---|
| 2017 Indicators | Chippewa County | Minnesota |
| Population (July 2016) | 12,133 | 5,519,952 |
| Labor Force | 7,020 | 3,019,047 |
| Average Unemployment | 4.7% | 3.7% |
| Average Annual Income (2016) | $37,648 | $54,288 |
| Cost of Living, Single Person | $24,881 | $29,856 |
| Cost of Living, two working parents + two children | $59,630 | $81,504 |
| Source: DEED Cost of Living in Minnesota 2017; DEED LAUS April 2017; U.S. Census Bureau, 2016 ACS, QCEW 2016 | ||
| Industry | |||||
|---|---|---|---|---|---|
| Chippewa | Top Industries of Employment 2015 | Total 2015 Employment | Percent Change 2006-2015 | 2015 Average Annual Wages | Percent Change 2006-2015 |
| - | Total, All Industries | 5,603 | -4.7% | $35,773 | 24.5% |
| 1 | Education and Health Services | 1,463 | 3.6% | $34,391 | 26.7% |
| 2 | Manufacturing | 1,229 | -4.2% | $43,542 | 16.4% |
| 3 | Trade, Transportation, and Utilities | 1,047 | -9.6% | $32,728 | 19.4% |
| 4 | Leisure and Hospitality | 390 | -2.3% | $13,163 | 68.9% |
| Source: DEED Quarterly Census of Employment and Wages 2006-2015 | |||||
Approximately 90% of the county is farmland. Although farming does not make up a significant portion of the jobs in the county, it provides other economic benefits. Total agricultural sales for the county in 2012 were $333,231,000, up from $169,002,000 in 2007. The average value of products sold per farm went up 111 percent from 2007 to 2012.3 The trend of higher productivity in the farmlands should continue to give higher output per farm with decreasing employment.
1Upham, Warren. "Geographical Naming History." Genealogy Trails, 2017.
2"Historic Sites in the Montevideo Area." Montevideo, Minnesota.
32012 Census of Agriculture, Chippewa County MN. (2013). Retrieved June 2, 2017.