by Tim O'Neill
September 2015
To analyze labor market information, one of the first things we must determine is geography. For example, the Department of Employment and Economic Development's (DEED) Local Area Unemployment Statistics (LAUS) tool has nine different options for geography. Nearly all of these options are expected and understood, including counties, large cities, metropolitan areas, and, of course, the state of Minnesota. Among these options, however, are micropolitan statistical areas. Often overlooked for their more commonly-known geographic cousins, micropolitan statistical areas will finally be given the limelight in this issue of Employment Review.
On a broad scale micropolitan statistical areas are "labor market areas." According to the Bureau of Labor Statistics (BLS), a labor market area is an economically integrated area in which individuals can reside and find employment within a reasonable distance or can readily change jobs without changing their place of residence.1. The United States Office of Management and Budget (OMB) is responsible for delineating metropolitan and micropolitan statistical areas. Overall, such areas consist of a substantial population nucleus, with strong economic and social integration of surrounding communities. Data is supplied by the U.S. Census Bureau to determine such areas.
Since 2000 the "core based statistical area" (CBSA) has referred to both metropolitan and micropolitan statistical areas. According to OMB standards from 2010, CBSAs must contain at least one urban area of 10,000 or more residents. Further breakdowns differentiate metropolitan and micropolitan statistical areas as:
Metropolitan statistical area: Must have at least one urbanized area of 50,000 or more residents.
Micropolitan statistical area: Must have at least one urbanized area of at least 10,000 or more residents, but less than 50,000 residents.
Under the current definitions, the central county for micropolitan statistical areas must have at least 50 percent of the urbanized area of 10,000 or more residents. Additional "outlying counties" may also be included in the CBSA if they meet specified requirements for commuting to or from the central county.2.
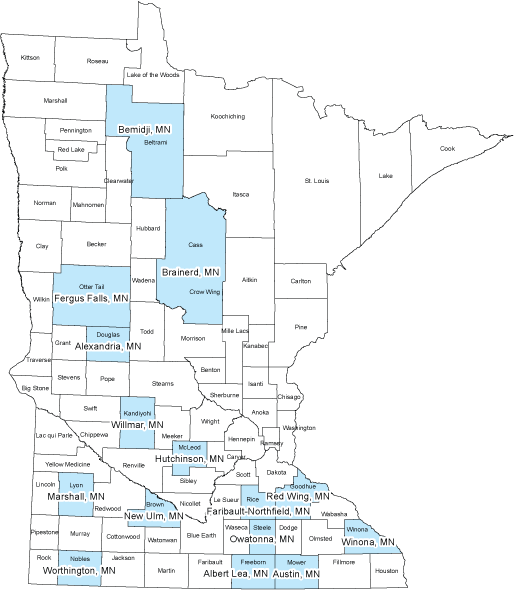
First established in 2003, micropolitan statistical areas were last reconfigured by OMB in February, 2013. At that time Minnesota had 15 micropolitan statistical areas.3. These 15 areas largely span southern and northwestern Minnesota, beyond the Twin Cities Metro Area (see Map).

In terms of population Minnesota's micropolitan statistical areas range from Worthington's 21,590 people of which the city's share is 12,764 to Brainerd's 91,824 people of which the city's share is 13,590. The average population for all 15 micropolitan areas equaled approximately 43,500 in 2014. With a grand total of approximately 652,000 people, the micropolitan statistical areas accounted for nearly 12.0 percent of the state's population.
In terms of population growth, the micropolitan statistical areas have lagged behind state growth. While Bemidji, Alexandria, and Faribault-Northfield each witnessed growth rates over 1.0 percent between 2010 and 2014, the combined total of all micropolitan areas only increased by 0.3 percent. This growth rate is far out-paced by the state's 2.8 percent growth during that time. Note also that the Minneapolis-St. Paul metropolitan statistical area (MSA) witnessed 4.4 percent population growth during this period (see Table 1).
| Table 1: Minnesota Micropolitan Statistical Areas | ||||
|---|---|---|---|---|
| Area | 2010 Population | 2014 Population | 2010-2014 Population Change | |
| Numeric | Percent | |||
| Minnesota | 5,310,418 | 5,457,173 | 146,755 | 2.8% |
| Minneapolis-St. Paul MSA | 3,348,857 | 3,495,176 | 146,319 | 4.4% |
| Albert Lea | 31,211 | 30,840 | -371 | -1.2% |
| Alexandria | 36,008 | 36,790 | 782 | 2.2% |
| Austin | 39,219 | 39,323 | 104 | 0.3% |
| Bemidji | 44,585 | 45,664 | 1,079 | 2.4% |
| Brainerd | 91,249 | 91,824 | 575 | 0.6% |
| Faribault-Northfield | 64,297 | 65,151 | 854 | 1.3% |
| Fergus Falls | 57,260 | 57,635 | 375 | 0.7% |
| Hutchinson | 36,608 | 35,882 | -726 | -2.0% |
| Marshall | 25,856 | 25,665 | -191 | -0.7% |
| New Ulm | 25,875 | 25,292 | -583 | -2.3% |
| Owatonna | 36,506 | 36,573 | 67 | 0.2% |
| Red Wing | 46,184 | 46,423 | 239 | 0.5% |
| Willmar | 42,245 | 42,285 | 40 | 0.1% |
| Winona | 51,393 | 51,097 | -296 | -0.6% |
| Worthington | 21,378 | 21,590 | 212 | 1.0% |
| Micropolitan Total | 649,874 | 652,034 | 2,160 | 0.3% |
| Source: U.S. Census Bureau, American Community Survey (ACS) | ||||
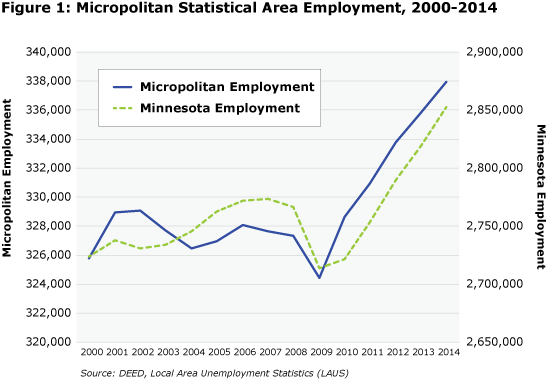
Employment and unemployment statistics available through DEED's Local Area Unemployment Statistics tool can shed further light on current realities and trends in the state's micropolitan statistical areas. For instance, if we analyze trends since 2000, we see strong employment gains in Bemidji, Faribault-Northfield, Fergus Falls, and Red Wing, also with promising gains in Marshall, Willmar, and Owatonna. Bemidji has lead the pack recently, with its share of residents holding jobs increasing by 11.9 percent or 2,365 persons between 2009 and 2014. Overall, employment in the combined micropolitan areas increased by 4.2 percent between 2009 and 2014 or about 13,550 (see Figure 1). For reference, employment growth during that time was 5.1 percent and 6.6 percent in Minnesota and the Minneapolis-St. Paul MSA, respectively.

For a more detailed look at industry employment, DEED's Quarterly Census of Employment and Wages (QCEW) tool comes in handy.4. In the annual 2014 data there were 295,309 jobs in the state's micropolitan statistical areas. One quarter (24.9 percent) of these jobs were in Educational and Health Services, with another one-fifth (20.1 percent) in Trade, Transportation, and Utilities. When comparing industry shares with the state, these top two industry super-sectors are nearly identical. The largest discrepancy between the micropolitan and state industry shares comes with Manufacturing. Where approximately 11 percent of the state's total employment is attributable to Manufacturing, over 18 percent of the micropolitan's share is. Further, while total micropolitan employment accounted for about 11 percent of the state's total employment in 2014, it accounted for over 17 percent of the state's total Manufacturing employment. The micropolitan statistical areas also had over 17 percent of the state's Natural Resources and Mining employment.
At the other end of the spectrum, employment in Professional and Business Services accounted for only about 7 percent of the micropolitan's total employment, although it accounted for 13 percent of the state's total employment. The micropolitan areas also had smaller shares of employment in Financial Activities (6.5 percent of the state's total) and Information (7.5 percent of the state's total).
With Manufacturing making up such a significant portion of the micropolitans' employment shares, it's encouraging to see that industry sector lead all other sectors with numeric growth between 2010 and 2014. Manufacturing's 8.7 percent growth rate for the micropolitans also surpasses state Manufacturing growth during that period (6.7 percent). Two other supersectors, Professional and Business Services and Public Administration, also surpassed state growth rates in the micropolitan areas.
Overall, industry employment in the micropolitan statistical areas increased by 11,270 jobs between 2010 and 2014, with its 4.0 percent growth rate slightly behind the state's 6.5 percent growth rate (see Table 2). 58.1 percent of this growth was in the Bemidji, Winona, Owatonna, Brainerd, and Alexandria micropolitan areas. Only the Bemidji and Owatonna micropolitan areas witnessed faster growth rates than the state.
| Table 2: Total Micropolitan Statistical Area Employment Growth, 2010-2014 | |||||
|---|---|---|---|---|---|
| Industry | 2014 Employment | 2010 Employment | 2010-2014 Employment Change | ||
| Numeric | Percent | MN Percent | |||
| Total, All Industries | 295,309 | 284,039 | 11,270 | 4.0% | 6.5% |
| Educational and Health Services | 73,471 | 71,842 | 1,629 | 2.3% | 6.0% |
| Trade, Transportation, and Utilities | 59,285 | 58,058 | 1,227 | 2.1% | 4.5% |
| Manufacturing | 53,365 | 49,113 | 4,252 | 8.7% | 6.7% |
| Leisure and Hospitality | 31,111 | 30,125 | 986 | 3.3% | 6.7% |
| Professional and Business Services | 20,921 | 17,925 | 2,996 | 16.7% | 11.7% |
| Public Administration | 15,853 | 15,666 | 187 | 1.2% | 0.8% |
| Construction | 12,597 | 12,075 | 522 | 4.3% | 20.1% |
| Financial Activities | 11,420 | 11,813 | -393 | -3.3% | 3.0% |
| Other Services | 8,424 | 8,391 | 33 | 0.4% | 5.2% |
| Natural Resources and Mining | 4,616 | 4,431 | 185 | 4.2% | 13.4% |
| Information | 4,217 | 4,575 | -358 | -7.8% | -2.7% |
| Source: DEED Quarterly Census of Employment and Wages (QCEW) | |||||
While population growth in the micropolitan statistical areas has been limited in recent years, and total industry growth has fallen behind that of the state's, the 652,000 people and 295,300 jobs in the state's 15 micropolitan statistical areas account for a very significant part of Minnesota's population and labor market. Exploring current statistics and historical trends raises further questions, however. For instance, what does the micropolitans' limited population growth mean for workforce supply? With Manufacturing so prominent, what subsectors are claiming the most growth? What are possible explanations for higher employment strength in Bemidji, Winona, and Owatonna? Future articles will explore these questions.