by Nick Dobbins
April 2020
Monthly analysis is based on unadjusted data
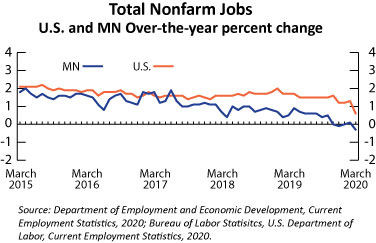
The Minneapolis-St. Paul-Bloomington MSA lost 11,074 jobs (0.6 percent) in March. It was the worst over-the-month job loss of any MSA in the state. Every supersector save Educational and Health Services (up 996 or 0.3 percent) lost jobs in March. Leisure and Hospitality was down 4,218 or 2.3 percent, the largest decline of any supersector. Professional and Business Services was down by 3,827 (1.2 percent), with most of those losses coming in Administrative and Support and Waste Management and Remediation Services (down 3,099 or 3 percent), the component sector that includes Employment Services. On the year the metro area lost 7,995 jobs (0.4 percent), slightly worse than the state’s 0.3 percent over-the-year job loss. The largest real and proportional loss came in Leisure and Hospitality, which was down 3,798, or 2.3 percent, with all of those declines coming in Accommodation and Food Services (off 3,995 or 2.7 percent). The largest real and proportional annual job growth in the area came in Government employment, which was up by 3,513 (1.4 percent) on the strength of growth of 3,047 jobs (1.9 percent) at the Local Government level. All of the growth in Local Government came in Educational Services, which was up 3,076 (3.3 percent).
Employment in the Duluth-Superior MSA was off by 555 (0.4 percent) on the month in March. Educational and Health Services lost 478 jobs (1.4 percent), the largest real and proportional decline of any supersector in the area. Only three supersectors added jobs, with the largest number coming in Government (up 88 or 0.3 percent) and the largest proportional growth coming in Information (up 2 percent or 25 jobs). Trade, Transportation, and Utilities lost 131 jobs (0.5 percent) with losses split between Retail Trade and Transportation, Warehousing, and Utilities. On the year the Duluth area lost 1,491 jobs or 1.1 percent. It was the worst proportional over-the-year job loss of any MSA in the state. Duluth’s declines came via a number of supersectors, but the largest real and proportional decline was in Mining, Logging, and Construction (down 804 jobs or 9.3 percent). Government employers lost 673 jobs (2.5 percent) on the year, with most of that decline coming at the Local Government level (down 712 or 4 percent). Trade, Transportation, and Utilities added 291 jobs (1.2 percent) on the year, thanks to a strong performance from Retail Trade (up 361 or 2.5 percent).
The Rochester MSA lost 330 jobs (0.3 percent) in March. Educational and Health Services drove the declines, off by 390 (0.8 percent). Running against the statewide trend, Leisure and Hospitality employment was up by 114 (1 percent), while the largest proportional gain came in Mining, Logging, and Construction, up 1.2 percent (57 jobs). Annually the Rochester area lost 541 jobs (0.4 percent). Educational and Health Services employment was down by 985 (1.9 percent), and Trade, Transportation, and Utilities was down 284 (1.6 percent), with much of those losses coming from the Retail Trade sector (down 247 or 2.1 percent). Government employers added 354 jobs (2.7 percent), and Mining, Logging, and Construction was up by 360 (8.1 percent).
The St. Cloud MSA added 130 jobs (0.1 percent) on the month in March, maintaining gains while statewide employment dropped 0.5 percent. Trade, Transportation, and Utilities drove the growth, adding 281 jobs (1.2 percent), with most of those gains coming in Retail Trade (up 269 or 4.3 percent). Mining, Logging, and Construction employment was up 11 or 1.9 percent. Six of the 10 published supersectors lost jobs on the month, with the largest real and proportional decline coming in Leisure and Hospitality, down 121 or 1.5 percent. On the year the MSA added 323 jobs (0.3 percent). As was the case over the month, gains in Trade, Transportation, and Utilities (up 604 or 2.7 percent) and Mining, Logging, and Construction (up 217 or 3.7 percent) helped to counter a large decline in Leisure and Hospitality (down 227 or 2.8 percent) among other contracting supersectors.
The Mankato-North Mankato MSA added 236 jobs (0.4 percent) in March, the best over-the-month performance of any MSA in the state. Every published level of employment saw positive growth, with private sector employers adding 156 jobs (0.3 percent) and public sector employers adding 80 (0.8 percent). The area also had the best over-the-year job growth, up 2.7 percent (1,558 jobs) at a time when statewide employment was down 0.3 percent. Goods producers added 217 jobs (2.1 percent), and service providers added 1,341 jobs (2.8 percent).
The Fargo-Moorhead MSA lost 124 jobs (0.1 percent) in March. Mining, Logging, and Construction lost 211 jobs (2.7 percent), and Government employers lost 201 jobs (1 percent). Information employment was up by 3.3 percent (103 jobs) on the month. Over the year the Fargo-Moorhead area added 1,632 jobs (1.1 percent), with all but two published supersectors showing positive annual job growth. Professional and Business Services led the way, adding 643 jobs (4.6 percent).
Employment in the Grand Forks-East Grand Forks MSA was mostly flat, up by 22 jobs (0.0 percent) with Government employers adding 151 jobs (1.1 percent) while Leisure and Hospitality lost 113 jobs (1.9 percent). Over the year the area lost 509 jobs (0.9 percent). All but two published supersectors lost jobs on the year, but Manufacturing gained 227 jobs (5.1 percent), the largest number of real job gains or losses of any supersector, helping to blunt some of the losses. The largest real decline came in Government, which shed 223 jobs (1.6 percent).
