by Amanda Rohrer
September 2022
While the COVID-19 pandemic disrupted industry and workers worldwide, those impacts were felt at different times and scales in different places and industries. Because of the social role of restaurants as gathering places and the universal nature of food as a necessity and an enjoyment, possibly the most disrupted industry was food and hospitality.
Prepared food has to be close to people and distributed fairly quickly or its quality or safety declines. It can't be remote. It also requires space and equipment for preparation; commercial kitchens can't be easily moved. People also patronize bars and restaurants not just for the product itself, but for reasons such as to mingle with others, to celebrate events, for the convenience when they're busy doing other things. Regulatory rules prohibiting mingling or requiring masks and the shifting of work and entertainment to remote options either closed dining rooms or deterred people from spending time in public spaces, or simply reduced their need for convenience foods.
Now, two years later, we can track the impacts of those trends through time.
The North American Industry Classification System (NAICS) is the coding system used to assign industries to businesses. It spans Agriculture to Public Administration and can either be used broadly or with very narrow definitions. Restaurants – food-serving establishments open to the public – fall mostly within the broad sector 72: Accommodation and Food Services. The specific establishment types within that include the following:
These types of establishments have different business models and correspondingly different responses to the changed circumstances of 2020 and beyond. In most cases they're compared to one another, but when restaurants are referred to as a group, all of these industries are referenced. Cafeterias are a very small industry with few establishments and workers, and in some cases it's excluded because drawing conclusions would be questionable.
Minnesota Business Employment Dynamics (BED) links Quarterly Census of Employment and Wages (QCEW) data across quarters to give a longitudinal history for each establishment that allows for tracking employment changes over time at each establishment, including business openings and closings.
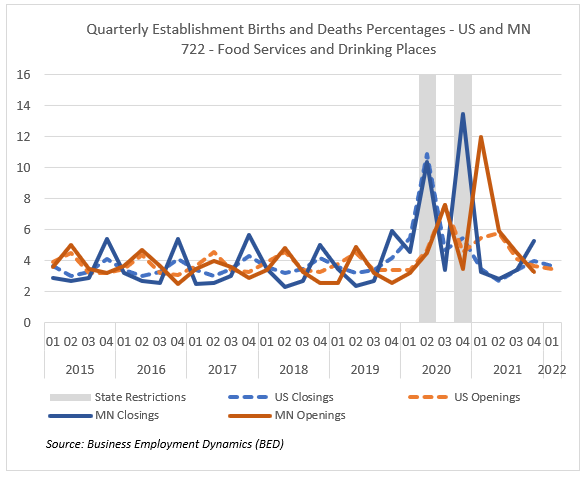
In the chart below we look at quarterly business openings and closures for the past seven years nationally and in Minnesota. In normal, pre-pandemic times the U.S. and Minnesota track closely except that Minnesota closures display a more seasonal trend, with a larger percentage closing in 4th quarter and fewer new openings occurring during that time. In March 2020 the first COVID-19 cases emerged and many states and municipalities including Minnesota shut down non-essential businesses. Marked by the first grey bar on the chart below, these restrictions again tracked closely between Minnesota and the U.S. During the spring and summer business was far from normal, but outdoor entertainment activities and a loosening of mandatory restrictions in favor of voluntary business policies led to some recovery. On November 20, 2020, another Minnesota executive order to "dial-back" activities was issued in response to rising cases. At this time Minnesota's pandemic numbers were not in alignment with other population centers in the U.S., with many major cities having experienced their peaks earlier in the fall. The percentage of closures in Minnesota greatly exceeded U.S. closures at that time, but the recovery in openings the following quarter was closer with the release of vaccines.
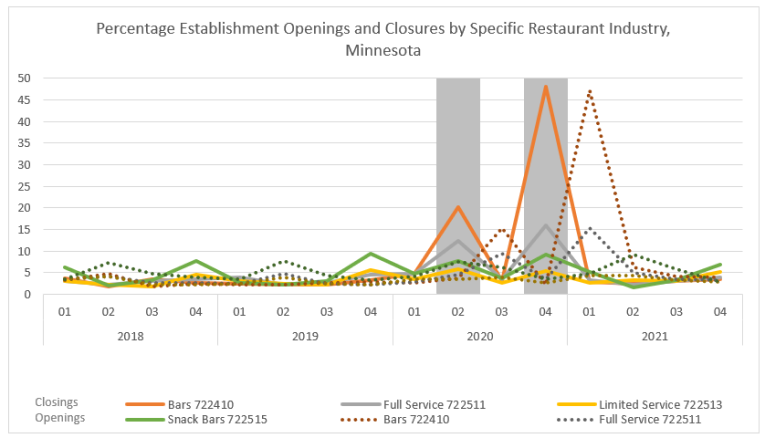
Businesses were more likely to stay open through the first closure – either because it was regarded as a short-term problem or because they had reserves or government supports. The impact of the second set of dial-back restrictions seemed to have a greater impact. Looking at more detailed establishment types in Minnesota, Snack Bars have the most seasonal pattern but were least disrupted by the second round of state restrictions. Bars and Full-Service restaurants were most impacted by both rounds of restrictions but recovered quickly afterwards.
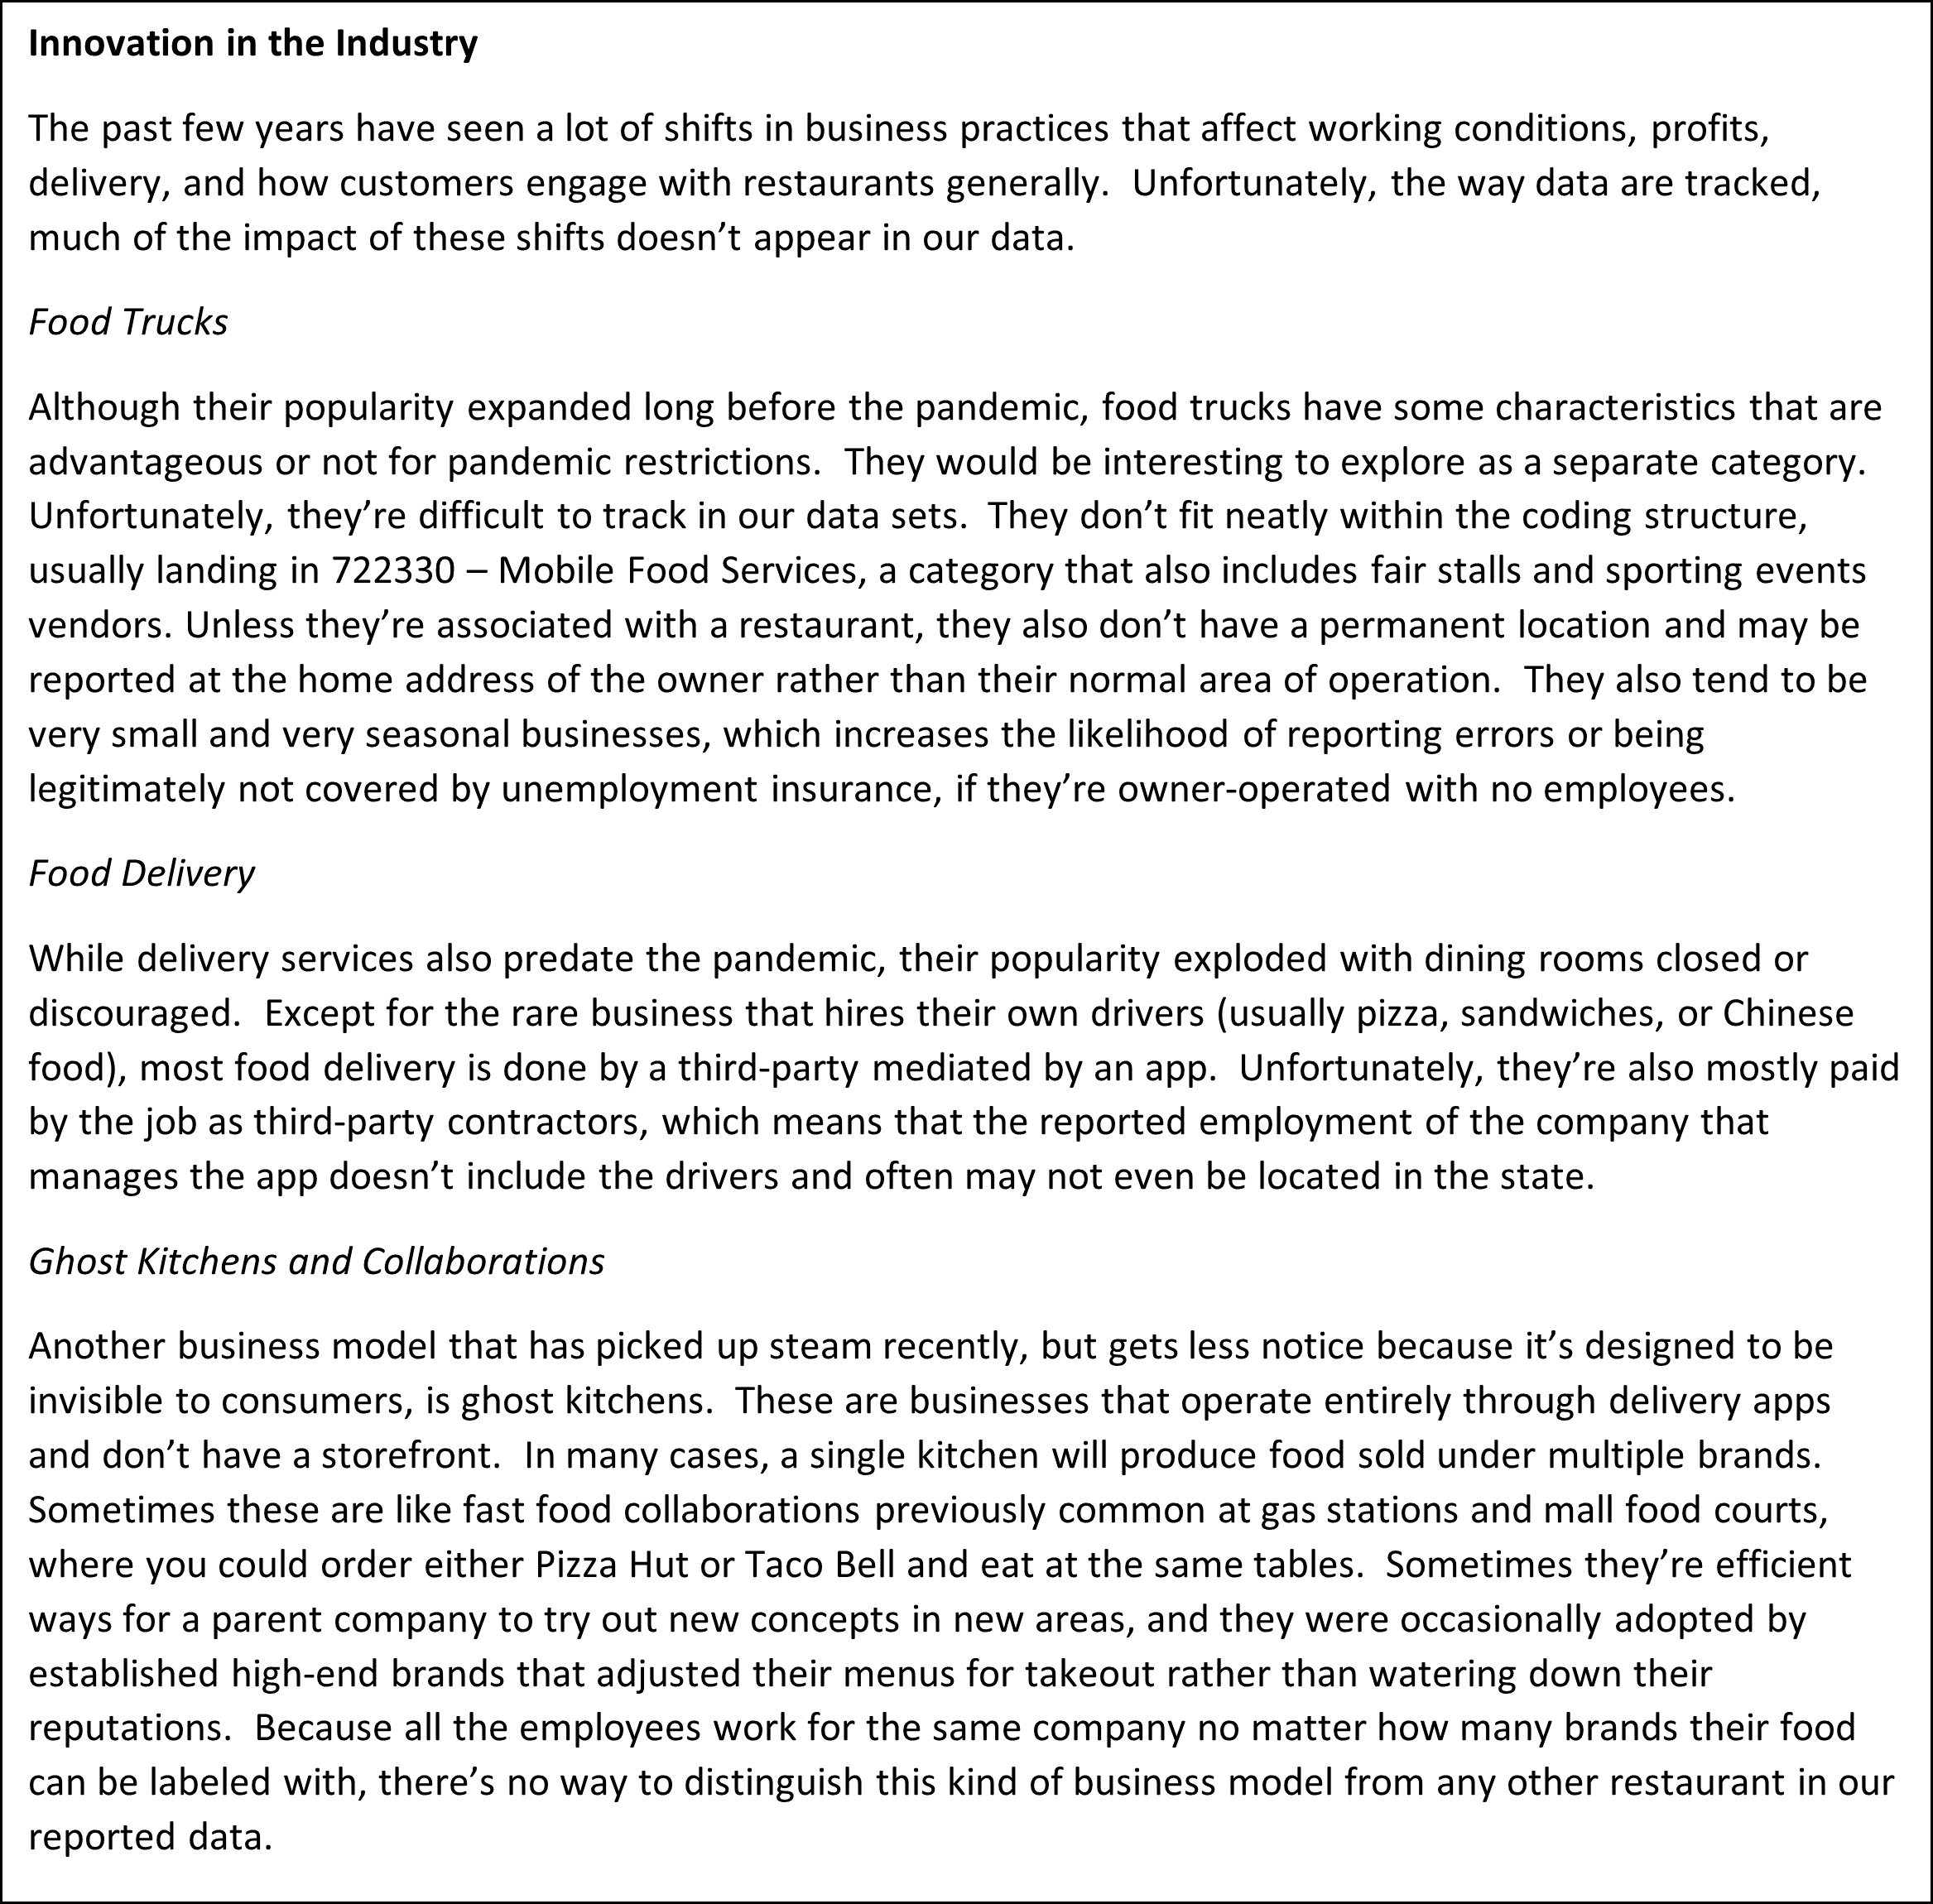
 The restaurant industry faces unique circumstances even in the best of times; low wages, high staff turnover, slim margins, and barriers to entry stemming from the cost of space have made business failure normal in the industry. But it has also encouraged innovation – the food truck trend of recent years required many in the industry to improve their social media and marketing presence, investigate different payment and ordering portals, and streamline menus. During the height of the pandemic, when dining rooms and gathering spaces were closed, many more businesses had to operate like a food truck: packaging meals for takeout, managing walk-up lines, and speeding payment.
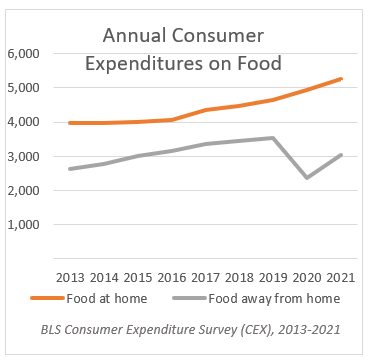
But despite innovation and adaptation, demand from consumers dropped precipitously in 2020. According to the BLS Consumer Expenditure Survey, the national average spent on food away from home declined 33% in 2020. While there was a stark recovery in 2021, it was still a 14% decline from 2019 expenditures, despite inflation.
All of these challenges have had both an immediate short-term impact on restaurant establishments and staffing, and have changed the shape of the industry in the long term.
From the Quarterly Census of Employment and Wages (QCEW) data, the employment decline in the second quarter of 2020 at the start of the pandemic was noticeable across all industries. It was most profound in Full Service Restaurants and Bars, which rely most heavily on dining rooms for their business models, but Snack Bars and Coffee shops (which tend to be convenience purchases, located in other places people gather like malls and office centers) were also significantly impacted. Breweries, which already typically have other means of distributing their product, did better, and Limited-Service restaurants saw a less abrupt decline in employment. In the second wave of dial back measures in 4th Quarter 2020, Snack Bars and Limited-Service restaurants were almost back to a typical seasonal pattern, while once again the Full Service restaurants and Bars were more dramatically impacted.
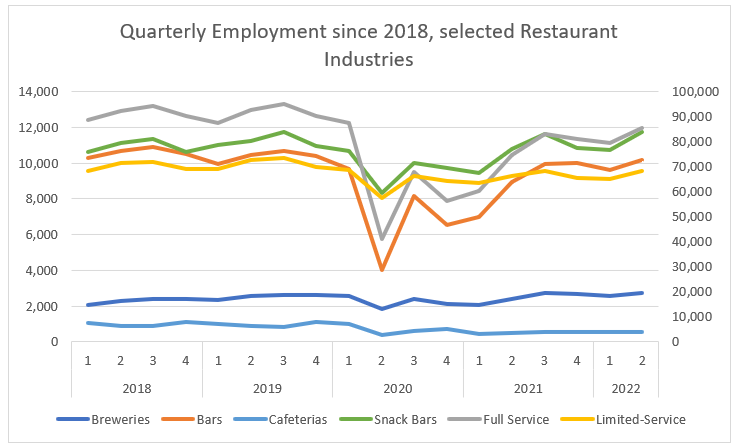
Overall, the only restaurant types that have recovered pre-pandemic employment levels are Breweries (previously on a stark growth track) and Snack Bars or Coffee Shops. Bars are close to previous employment, and Limited-Service are out-performing Full Service restaurants.
| Employment Recovery 2019 Q2 to 2022 Q2 | |
|---|---|
| Breweries | 6.6% |
| Bars | -2.8% |
| Full Service | -7.6% |
| Limited-Service | -5.7% |
| Snack Bars | 4.6% |
| Source: QCEW | |
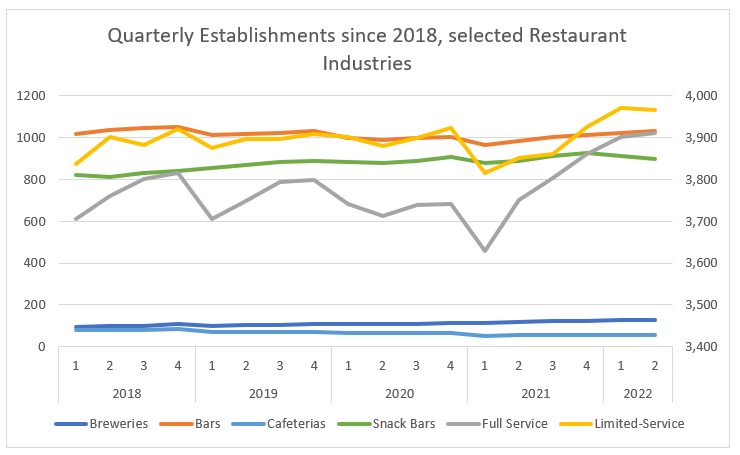
Employment isn't the only measure of recovery, though. The industry is struggling to find workers and it's possible that some of the changes implemented in the past few years could require fewer workers while accommodating the same customers. For the same period, the number of establishments has grown for all but Cafeterias, which was already the smallest category of restaurant. There was a noticeable decline in establishments in both early 2020 in the first wave of pandemic closures, and more significantly after the second round of closures in the early part of 2021, but those spaces have been filled since.
Location Quotient is a measure of industry concentration – the ratio of industry employment to overall employment in a region is compared to the ratio of the same industry to overall employment in a larger (usually U.S. total) region. A Location Quotient of 1 means a normal distribution of businesses, under 1 is an unusual lack of businesses, and over 1 is a higher than typical concentration. By comparing Location Quotients from pre-pandemic to now, we can determine if particular types of restaurants weathered the storm better in Minnesota than nationally, or if these changes are consistent with the country overall.
Pandemic trends didn't have a substantial impact on the number of establishments statewide and didn't significantly shift the types of establishments that survived. Breweries were on a significant growth trajectory prior to the pandemic and that has continued. Bars have also grown in number and had the most significant increase in Location Quotient, although still less than 0.1. All other types, except the very small category of Cafeterias, saw minor absolute growth and little change in LQ.
| Pandemic Impact on Industries and Location Quotient Statewide, 2020 and 2022 | |||||
|---|---|---|---|---|---|
| - | 2020 Q1 | 2022 Q1 | |||
| Establishments | LQ | Establishments | LQ | ||
| 312120 | Breweries | 108 | 1.25 | 129 | 1.33 |
| 722410 | Bars | 987 | 1.34 | 1,013 | 1.41 |
| 722511 | Full Service | 3,737 | 0.86 | 3,893 | 0.89 |
| 722513 | Limited-Service | 3,895 | 0.91 | 3,958 | 0.9 |
| 722514 | Cafeterias | 67 | 0.63 | 54 | 0.58 |
| 722515 | Snack Bars | 881 | 0.76 | 904 | 0.72 |
| Source: BLS Quarterly Census of Employment and Wages (QCEW), Employment and Wages Data Viewer | |||||
Despite the quick return to normal after changes in consumer behavior and regulatory differences, there were underlying permanent shifts. If we dig more deeply into specific types of establishments and their locations, not all areas have recovered.
Particularly in the restaurant industry, though, the number of workers is only part of the story. Staff can work variable shift lengths and opening hours can change. Anecdotally, many restaurants are reducing hours because of staff shortages or inflation related cost increases. The Quarterly Employment Demographics (QED) data, which link the hours and wages reported for individual workers to the demographic information of drivers' licenses and the QCEW-reported business characteristics, have an abundance of detail for exploring those changes more deeply.
| Change in hours from Q4 pre-pandemic to 2021 Q4 | ||
|---|---|---|
| - | 2019 | 2018 |
| Bars 722410 | -6.4% | -7.2% |
| Full Service 722511 | -10.1% | -10.9% |
| Limited-Service 722513 | -6.8% | 1.7% |
| Snack Bars 722515 | 2.8% | 9.7% |
| Source: QED | ||
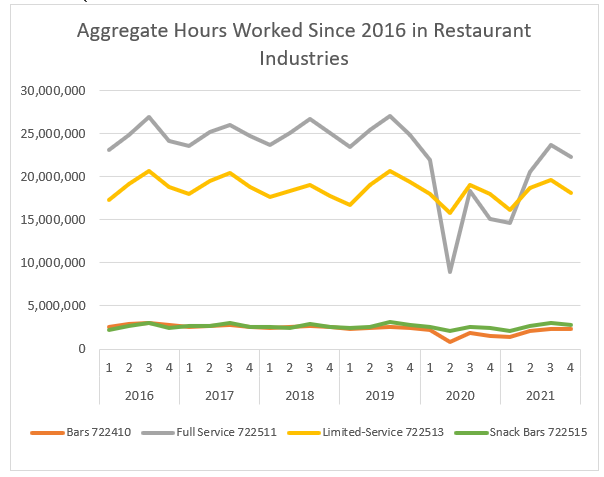
Despite shifts in the number of workers, the hours worked at types of establishments has been pretty stable for all but Full Service Restaurants and Bars. While they're a smaller category generally, Snack Bars have experienced growth in the number of hours worked.
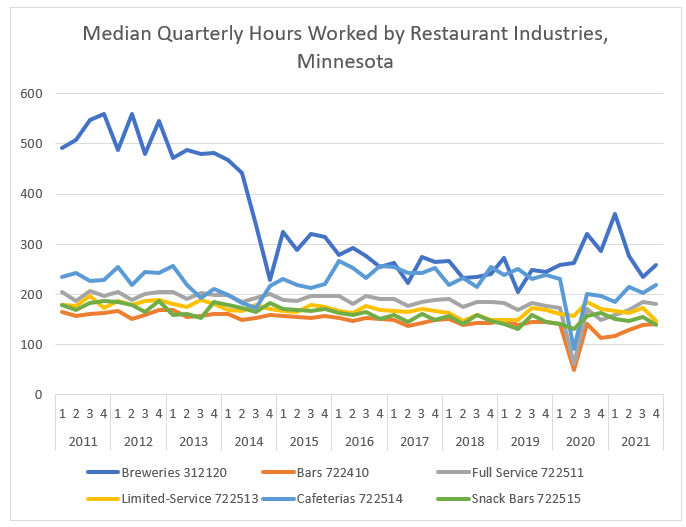
In 2021 the median quarterly hours worked for all Minnesota workers was 428, the equivalent of a 35 hour work week. This varies between industries and across genders. Pre-pandemic in 2019, Accommodation & Food Services workers had a median of 175 hours per quarter. Breweries are a manufacturing industry, but in 2011 the Surly Bill greatly expanded the options for beer manufacturers to sell directly to consumers and have dining rooms. Since then, the number of establishments has skyrocketed, and the share of workers who serve customers, as opposed to brewing, bottling, or maintenance, has shifted. With that shift, the median number of hours worked in the industry has dropped. All through the past decade, though, restaurant workers were working gradually fewer hours, except in Cafeterias which are an extremely small category and can be swayed by a relatively small number of workers. During 2nd Quarter 2020, workers in all types of restaurants (excluding Breweries) saw hours reduced significantly. In 4th Quarter 2020, with dial back restrictions, hours dropped again. Median hours have since recovered. Unfortunately, there's a lag in this data set, preventing us from seeing if the median hours have increased further given staffing shortages.
QCEW reports wages in aggregate, which causes industries with a wide range of compensation levels and hours worked to appear better paid. Using QED allows us to account for the number of hours worked and take a median. While it still doesn't adjust for occupations within the industry, it at least reduces the impact a small number of very highly paid workers can have on the total. Note: there are some reporting issues with hours. While most employers are accurate in their number of hours, sometimes these are estimated, and there can be unrealistic outlier wages in the data set. Because we're using medians, those were not removed or imputed for the purposes of this analysis.
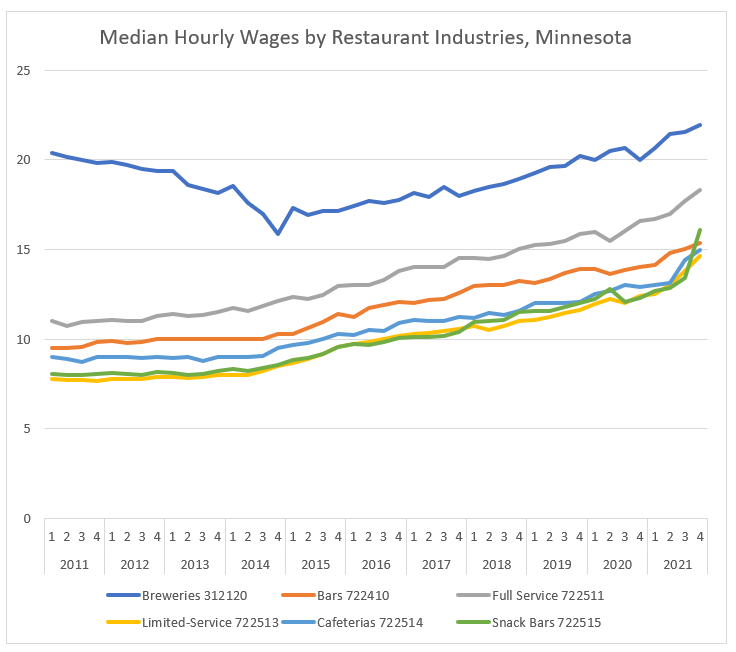
In the restaurant industries, wages have been increasing significantly in both the long term and more abruptly in the past year, particularly at Snack Bars and Coffee Shops.
In the past five years, since 4th Quarter 2016, wages have increased between 23.9% at the already better compensated Breweries to 59.8% at Snack Bars and Coffee Shops
| Median Hourly Wage Change 2016 Q4 - 2021 Q4 | |
|---|---|
| Breweries 312120 | +23.9% |
| Bars 722410 | +27.3% |
| Full Service 722511 | +32.7% |
| Limited-Service 722513 | +43.9% |
| Cafeterias 722514 | +37.3% |
| Snack Bars 722515 | +59.8% |
| Source: Quarterly Employment Dynamics (QED) microdata | |
That growth is substantial, and it's supported by data from the Occupational Employment & Wages Survey (OEWS). This data source surveys employers for the occupations and job titles of individual workers and looks at their rates of compensation. For that same time period, occupations that are concentrated in restaurant industries saw growth of 30 to 50% in wages.
| Hourly Wage Change - Selected Food Service Occupations Minnesota | ||||
|---|---|---|---|---|
| - | - | 2016 | 2021 | Percent Change |
| 351012 | First-Line Supervisors of Food Preparation and Serving Workers | $14.31 | $19.44 | +35.8% |
| 352011 | Cooks, Fast Food | $8.96 | $13.3 | +48.4% |
| 352021 | Food Preparation Workers | $11.32 | $15.24 | +34.6% |
| 353011 | Bartenders | $9.19 | $12.07 | +31.3% |
| 353031 | Waiters and Waitresses | $9.04 | $12.34 | +36.5% |
| 359011 | Dining Room and Cafeteria Attendants and Bartender Helpers | $9.19 | $12.24 | +33.2% |
| Source: Minnesota Occupation, Employment, and Wage Survey (OEWS) | ||||
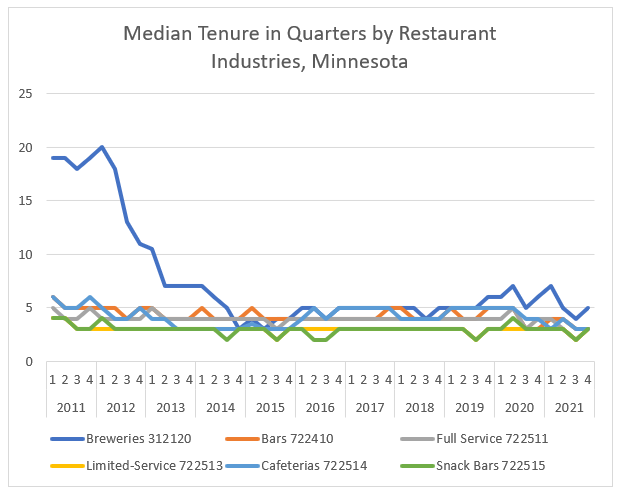
Another detail tracked by the Quarterly Employment Demographics source is an individual's tenure in quarters at a particular employer. Even pre-pandemic workers tended to stay only about a year in restaurant positions, so the slight reduction in tenure of the recent year isn't that notable.
We know that there was change in the restaurant industry beyond just the number of establishments and employment. Delving further into the types of establishments that closed and what replaced them can be interesting as well.
Looking at the cohort of restaurants that were active in QCEW data in 1st Quarter 2020 but no longer active by 2nd Quarter 2022, the largest share of the closures (36.8%) were Limited-Service restaurants. Full Service was next and nearly as high, while Snack Bars made up 22.7% of the closures. Relative to the current distribution of restaurants, this is consistent with, but slightly low for Full and Limited Service and dramatically high for Snack Bars, which make up only 9.0% of restaurants. The distribution of restaurants surviving that span is disproportionately made up of Bars and Breweries, with Snack Bars being low. New opens since 2020 were most disproportionately Snack Bars. Given their high failure rate, this suggests that Snack Bars and Coffee Shops have either relocated or must operate under different business models since there's still optimism in the industry, but there has been a high replacement rate for the businesses themselves.
| Restaurant Status Change since 2020 Q1 by Type | ||||
|---|---|---|---|---|
| - | Closures | Survival | Opens | All Firms (2022 Q2) |
| Breweries 312120 | 0.2% | 1.3% | 1.1% | 1.3% |
| Bars 722410 | 6.1% | 11.1% | 7.4% | 10.3% |
| Full Service 722511 | 32.8% | 39.8% | 36.9% | 39.2% |
| Limited-Service 722513 | 36.8% | 40.9% | 33.9% | 39.7% |
| Cafeterias 722514 | 1.4% | 0.6% | 0.5% | 0.6% |
| Snack Bars 722515 | 22.7% | 6.3% | 20.3% | 9.0% |
| Source: QCEW Liability and EOL dates | ||||
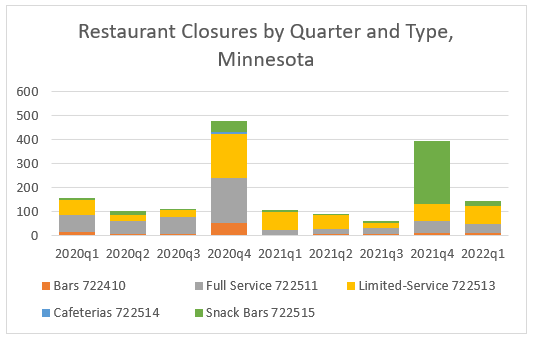 Most of the Restaurant closures happened in 4th Quarter 2020 during the second round of dial back restrictions. There were reports that they were suffering long before that, but by that time reserves were likely exhausted. The distribution of closures was largely in line with the overall firm types. In 2020, closures were disproportionately Full Service Restaurants and after 2020 they were more Limited-Service Restaurants. In 4th Quarter 2021 there was a second wave of failures, heavily concentrated in Snack Bars and Coffee Shops. This is when more office parks and businesses were committing to permanent work from home or hybrid schedules and had time to adjust to their changing space needs. Snack Bars tend to be convenience foods where people are – those closures likely reflect the shift in where people are during the day.
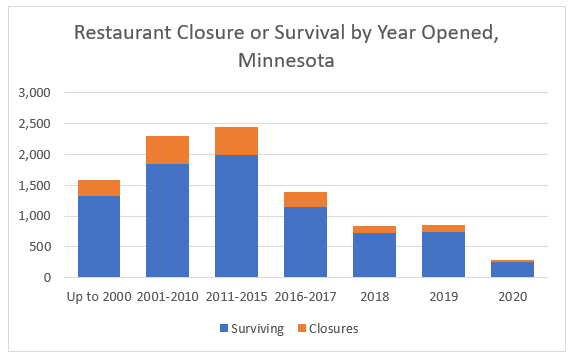
The restaurants that failed were largely long-established businesses, opened in 2000-2015. More recently opened businesses had a slightly lower rate of closure since 2020. This may reflect differences in business models, such as adapting to trends and delivery methods, or in access to capital to pull through difficult times.
| Percent of Restaurants Closing after 2020 by Year Opened | |
|---|---|
| Up to 2000 | 16.0% |
| 2001-2010 | 19.6% |
| 2011-2015 | 18.5% |
| 2016-2017 | 17.5% |
| 2018 | 13.7% |
| 2019 | 13.5% |
| 2020 | 14.6% |
| Source: QCEW | |
Newly opened restaurants since 2020 were somewhat evenly distributed. Even in the height of the pandemic, entrepreneurs were trying out new concepts. There was a rush after vaccines became readily available in 2nd Quarter 2021 and an increased number of openings after that. The new Snack Bars that opened corresponded to the time that the previous wave had closed, suggesting a shift in location or concept rather than straight failure from a lack of business or increased costs.
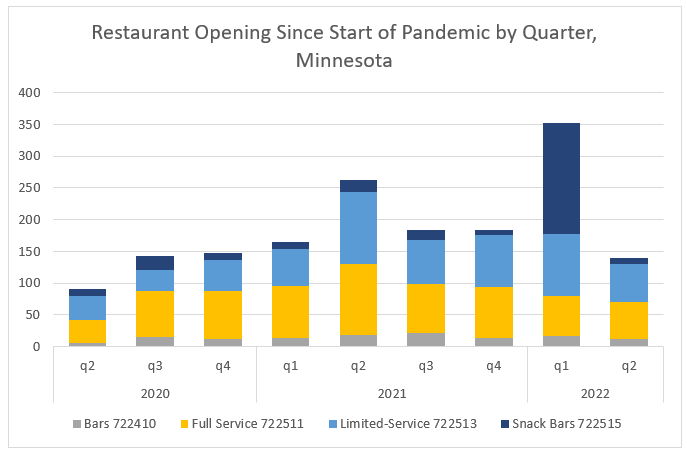
But where did all those Snack Bars and Coffee Shops go? Did they reopen in the same spaces? They're largely a convenience service for people who are away from home, and one possibility is that they've moved closer to their customers who now work from their homes.
To identify areas that may be impacted by the shift to remote work, we looked at the Census Bureau's Current Population Survey (CPS) Pandemic Supplement – Work from Home. The industries that remote workers were most likely to work in were Financial Activities, Professional and Business services, and Information.
Because the workers who can mostly work from home are concentrated in some broad industries, we combined those and created a location quotient for census tracts for industries with mostly remote-work eligible office workers. Census tracts were used because the unit of analysis was mostly small enough to reflect the range of space in which a worker may move during the workday – larger units of analysis like cities encompassed too much area. Location Quotient (LQ) was used to divide the state into 3 types of areas – heavily concentrated (LQ>2.0), moderately concentrated (LQ between 1.5 and 2.0), and not concentrated (LQ<1.5).
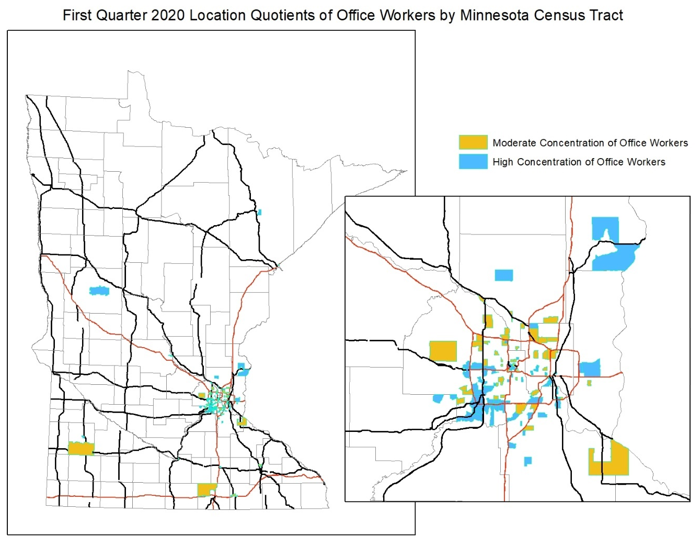
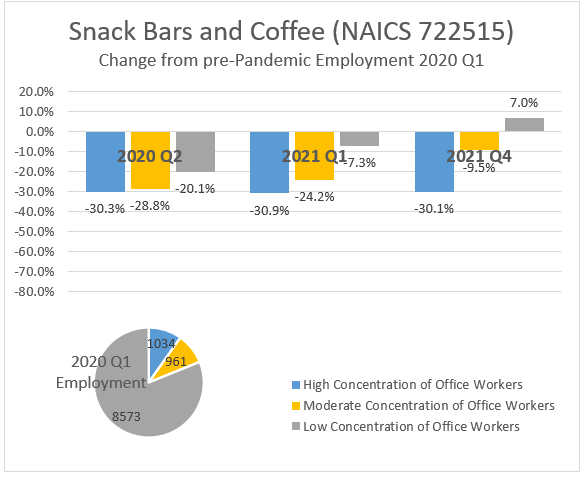
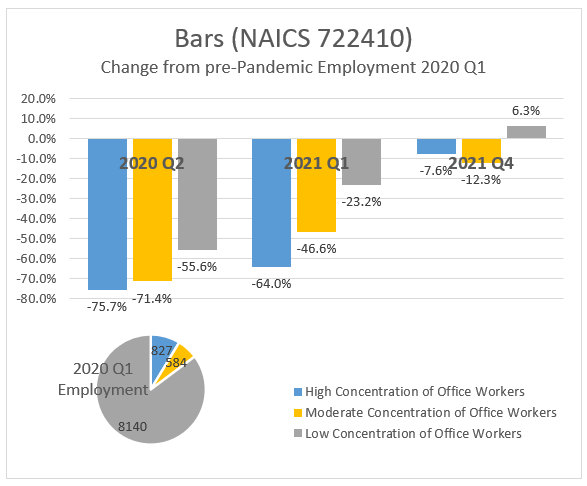
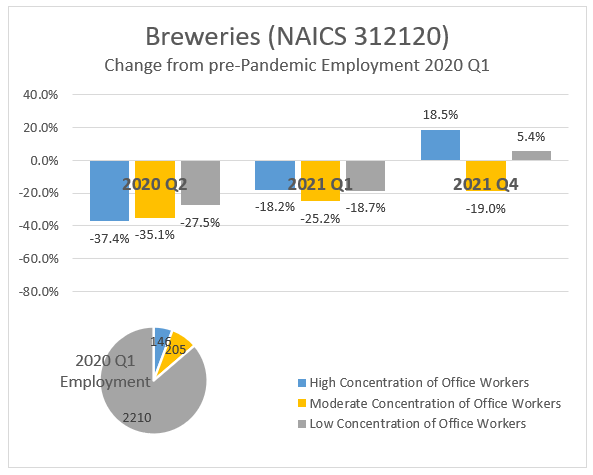
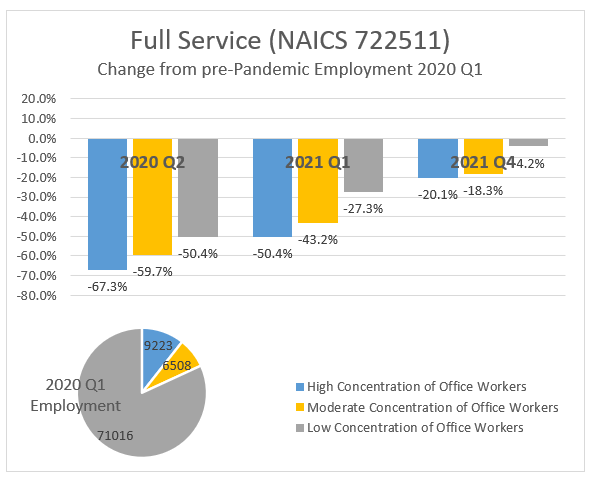
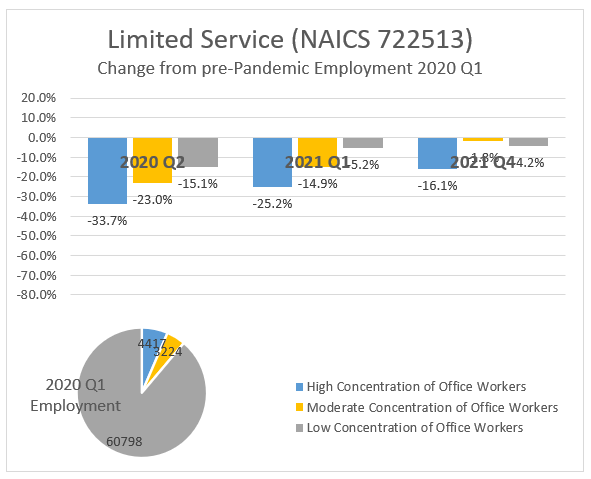
The largest declines in employment in areas with a large number of office workers were Snack Bars and Coffee Shops, which dropped off by 30% immediately at the start of the pandemic and remained down by that amount into the 4th Quarter 2021. All other restaurant types dropped off more significantly at the start but have made strides back to normalcy in those areas consistently since 2020. Breweries have actually grown in office areas, an interesting trend considering that they often locate in former industrial areas.
In areas with a more moderate concentration of office workers, the recovery has been more consistent by type of restaurant, although all categories have lower employment in 4th Quarter 2021 than they did in 1st Quarter 2020.
Areas with a lower concentration of office worker industries fared better – they saw fewer declines in employment right off in all restaurant industries and have recovered or nearly recovered across the board. In three categories – Snack Bars and Coffee Shops, Breweries, and Bars – they have actually seen growth. Given the growth trend of Breweries, that's unsurprising, but the shift of Coffee Shops and Bars – previously often serving workers going to or leaving work – to places with fewer large offices suggests they're adapting to the changing commuting patterns.
2020 and beyond has been a transformative time for the restaurant industries. Some businesses weathered the storm and came back, while others closed. Many of the closures were replaced despite challenges with costs and staffing, and Minnesota still has a rich dining scene. In the aggregate, convenience-oriented types of restaurants with lower entry costs (they don't require full kitchens) have made location shifts away from office areas and into residential or recreational areas more convenient for ongoing remote workers. Workers have made significant wage gains, and there were changes in the staffing patterns and number of hours worked.