by Mohamed Mourssi-Alfash
October 2013
Finding and retaining talented, diverse employees is important for businesses to stay competitive. Highly qualified job seekers with disabilities are frequently overlooked and underestimated. Recent reports show that about nine million unemployed Americans with significant disabilities are seeking jobs. Federal, state and local governments, along with chambers of commerce and nonprofit organizations, are working with people with disabilities to improve their job opportunities and workplace support.
In 2010 the United States celebrated the 20th anniversary of the Americans with Disabilities Act (ADA), signed into law in 1990. To honor that occasion President Barack Obama signed an executive order directing the federal government to hire an additional 100,000 federal employees with disabilities over five years. In another significant step the U.S. Department of Labor in December 2011 proposed and later instituted a rule encouraging federal contractors to ensure that at least 7 percent of their workforces are made up of people with disabilities.
In Minnesota Governor Mark Dayton announced on several occasions that hiring more people with disabilities should be a priority for the state government. The Dayton's Reform 2020 budget package invests about $400,000 in a two-year plan (2012-2014) to support 18- to 26-year-old Minnesotans with disabilities in getting access to employment. Under this policy community organizations will help their clients resolve job issues, benefits planning and integration of all services they may need to be ready to enter the workforce.
The following disability employment status analysis summarizes the most recent demographic and economic statistics on employment of the non-institutionalized population with disabilities in Minnesota, ages 21-64. This report contains information on the population size and disability prevalence for various demographic subpopulations, as well as statistics related to workforce participation, employment, full-time/full-year status, and poverty. The report also provides comparisons with people without disabilities and across demographic groups in Minnesota.
Numbers and charts in this article are based on the 2011 American Community Survey (ACS) data. The ACS survey replaced the Decennial Census long form in 2005 and thereafter by collecting long-form-type information throughout the decade rather than once every 10 years. After the conversion from Decennial Census to American Community Survey, ACS data became the most current and relevant data on disability status and employment both nationwide and at the state level. Under the old Decennial Census system, long-form data were collected at the beginning of each decade, a process that yielded outdated data of diminished value and relevance.
Disability status covers six major categories:
| Table 1 | ||
|---|---|---|
| Disability Prevalence | ||
| Location | Estimate | Base Population |
| Disability Prevalence in the Entire Population | ||
| U.S. | 12.1% | 307,263,600 |
| Minnesota | 9.9% | 5,288,600 |
| Disability Prevalence in the Working Age all Groups | ||
| U.S. | 10.5% | 180,037,400 |
| Minnesota | 7.9% | 3,476,700 |
Table 1 shows that in 2011 about 9.9 percent of the entire non-institutionalized population in Minnesota reported a disability, while the national prevalence rate is 12.1 percent. Out of the 5,288,600 non-institutionalized people living in Minnesota there are about 52,371 persons with disabilities or about one out of 10. The prevalence in the working age group, ages 21-64, drops to 7.9 percent in Minnesota and 10.5 percent at the national level.
Figures from the 2011 ACS data indicate that working-age individuals with disabilities dropped out of the workforce during the recession at a rate five times higher than that of workers without disabilities. Recent reports also show that the vast majority of working-age citizens with disabilities are not working and have given up looking for work. According to the 2011 ACS, only 33.4 percent of working age people with disabilities were in the workforce and only about 27.6 percent were actually working. In other words, 6,298,772 of 18,858,600 men and women with a disability in the United States were employed.
Minnesota's employment rate for people with disabilities is about 47 percent, the second-highest in the nation following North Dakota. That is far below the overall 2011 employment rate in Minnesota, which was 81.8 percent.
Table 2 shows the employment rates among people with disabilities of working age compared with the employment rates of people without disabilities in the U.S. and in Minnesota.
| Table 2 | |||
|---|---|---|---|
| Employment Rates | |||
| Location | Population | Percent Working | Number Working |
| Employment Rate in Entire Population (21-64) | |||
| U.S. | 180,037,400 | 71.2% | 128,186,629 |
| Minnesota | 3,117,500 | 79.1% | 2,465,943 |
| Employment Rate in Working Age (21-64) with Disability | |||
| U.S. | 18,858,600 | 33.4% | 6,298,772 |
| Minnesota | 245,100 | 47.7% | 116,913 |
| Employment Rate in Working Age (21-64) without Disability | |||
| U.S. | 161,178,900 | 75.6% | 121,851,248 |
| Minnesota | 2,872,400 | 81.8% | 2,349,623 |
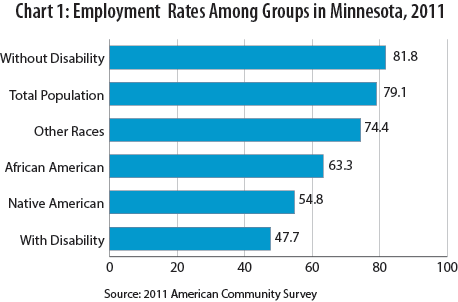
Although Minnesota's rate of employment among people with disabilities was relatively high compared to other states, our rate of people with disabilities participating in the workforce is still far lower than any other group in Minnesota tracked by the ACS survey as shown in Chart 1.

Figures in Chart 1 indicate that disabled Minnesotans are by far the least likely to be employed compared with other groups. In 2011, 47.7 percent of working-age disabled people were employed compared with 81.8 percent of working-age non-disabled people. The ACS results also show that employment rates for other groups in Minnesota are: 63.3 percent among African American, 74.4 percent among other races, and 54.8 percent among Native Americans.
This section provides a snapshot of the ratio of full-time/full-year employment among working-age people with disabilities. A worker is considered employed full time when working 35 or more hours per week and acquires full-year status when working 50 or more weeks per year.

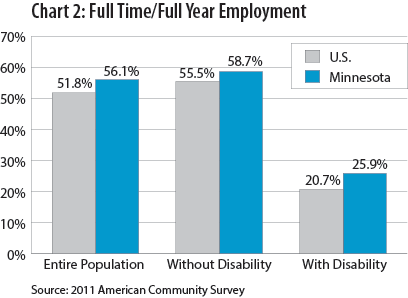
Chart 2 shows that workers with a disability in 2011 were less likely to work full-time than those with no disability. Among workers with a disability, only 20.7 percent of working aged people with a disability in the U.S. claimed a full-time/full-year employment status, while the ratio for full-time/full-year status was 55.5 percent for workers without disability, more than double the ratio of workers with disabilities. In Minnesota the ratio of full-time/full-year employment among working-age people with disabilities was 25.9 percent compared with 58.7 percent for workers without disabilities.
The official U.S. poverty measure is based on the federal poverty thresholds created in 1982 and adjusted annually to be aligned with cost-of-living increases. The poverty level is calculated based on the cost of minimum food consumption with the assumption that families spend a third of their income on food. These poverty thresholds consider the size of the family and are indexed to 2008 dollars using poverty factors based on the Consumer Price Index. The poverty level in this report specifies the percentage of people with disabilities in the working age group in the United States and in Minnesota who were living below the poverty line in 2011.

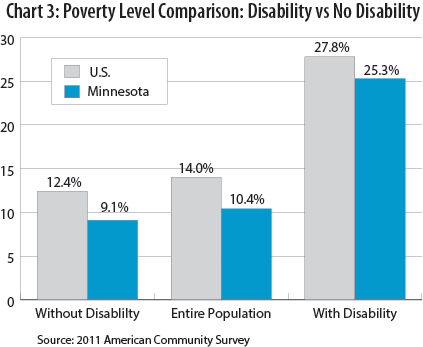
Chart 3 indicates that in the year 2011 an estimated 27.8 percent, or 5,241,700 out of 18,825,800 people in the working-age group with a disability in the United States, were living below the poverty line. This is about twice the rate of poverty among working-age citizens without disabilities which was 12.4 percent in 2011. In Minnesota 25.3 percent of working-age people with disabilities are living under the poverty level accounting for 61,833 out of the 244,400 working-age Minnesotans with disabilities from all groups.
The high rate of poverty among working-age people with disabilities is driven by several factors, including lack of earnings caused by the low participation in the workforce and low earnings caused by the low rate of full-time/full-year participation. The 2011 ACS data show that the annual earnings of workers with disabilities are lower than those of workers without disabilities among the working-age population at both the national and state levels. A third possible factor is wage inequality, meaning that employees with disabilities may receive lower wages than their counterparts without disabilities who occupy similar jobs and perform similar duties.
Figures from the 2011 ACS data show that Minnesota has proved to be a better place for people with disabilities to work than most other states. Minnesota is ranked number two in the nation in the rate of employment for people with disabilities. In addition, the poverty rate among people with disabilities in Minnesota is one of the lowest in the nation. The federal government also has a website, that lists in one place more than 100 services available to Minnesotans with disabilities. However, there is still more to be done, such as determining new approaches that can significantly boost employment of Minnesotans with disabilities and establishing Minnesota as the model state for disability employment.
U.S. Senate Committee on Health, Education, Labor, and Pensions
2012 Annual Disability Statistics Compendium
U.S. Census Bureau; American Community Survey, 2011 American Community Survey 1-Year Estimates
Center for Research on Disability
Disability Funders
She, P. and G. Livermore (2006). Long-Term Poverty and Disability Among Working-Age Adults. Rehabilitation Research and Training Center on Employment Policy for Persons with Disabilities, Cornell University, Ithaca, NY.
She, P. and G. Livermore. Long-term Poverty and Disability Among Working-Age Adults. Journal Of Disability Policy Studies, vol. 19 (4), pp. 244-256, 2009.
Livermore, G., D. Stapleton, and A. Roche. Work Activity and Use of Employment Supports Under the Original Ticket to Work Regulations: Characteristics, Employment, and Sources of Support Among Working-Age SSI and DI Beneficiaries. Washington, DC: Mathematica Policy Research, 2009.