by Alessia Leibert
April 2014
A college education is one of the biggest investments most people ever make. Yet until now not a lot of data on job outcomes existed to help with the decision. How quickly did graduates find a job in the state? How much did the jobs pay? How stable was their employment? In a time of rising tuition costs, prospective students need access to high quality information to make smart choices about their future.
The Minnesota Department of Employment and Economic Development (DEED) just released the Graduate Employment Outcomes tool, a new online tool that provides a wealth of information on how recent graduates in different majors fared in the Minnesota job market.
The tool represents the collaborative efforts of DEED and the Minnesota Office of Higher Education to collect and securely link workforce data with education data. Students who earned a post-secondary award in Minnesota were followed longitudinally through education into the workforce using Unemployment Insurance wage records. Reports will be updated with a new cohort of students each year.
The Graduate Employment Outcomes tool is intended to help a variety of audiences, including:
The tool displays key aspects of employment which are described in detail below. Examples of each metric are shown in Table 1.
| Employment and wage outcomes of Minnesota post-secondary program completers by award level, class of 2011 | |||||||
|---|---|---|---|---|---|---|---|
| - | 1 - Percent employed 12 months after graduation | 2 - Median hourly wage at 12 months | 3 - Hourly wage increase from 12 to 24 months | 4 - Top industry of employment | 5 - 2nd year median wages, working any hours | 6 - 2nd year full-time year-round employment[1] | 7 - 2nd year full-time year-round median wages |
| All awards | 67% | $16.51 | $1.90 | Health Care and Social Assistance (24%) | $28,518 | 42% | $41,475 |
| Sub-baccalaureate Certificates | 71% | $14.20 | $1.48 | Health Care and Social Assistance (28%) | $22,119 | 35% | $34,696 |
| Associate Degree | 72% | $14.63 | $1.38 | Health Care and Social Assistance (34%) | $23,240 | 36% | $36,946 |
| Bachelor's Degree | 63% | $16.16 | $2.41 | Health Care and Social Assistance (18%) | $28,798 | 44% | $40,207 |
| Graduate Degree (Master's, PhD, etc.) | 63% | $30.14 | $2.22 | Education (38%) | $51,924 | 50% | $64,354 |
|
Sources: MN Department of Employment and Economic Development; Minnesota Office of Higher Education (OHE). Data on each individual completing a degree from July 2010 through June 2011 were linked with wage records from all employers subject to Unemployment Insurance taxes in Minnesota. 1Percent of employed graduates who worked during each of the four quarter of the year and who worked at least 1,820 hours, representing an average of 35 hours a week. |
|||||||
The findings in Table 1 indicate that:
The data presented in this tool are the foundation for evaluating the effectiveness of public investments to build a competitive workforce and for identifying emerging areas of educational opportunities that might have been overlooked in the past. This can help students find a successful path from high school to college and into the workforce.
The tool allows two types of comparisons: "vertical" and "horizontal". Table 1 is an example of vertical comparison because it compares student outcomes by award level across all majors. Horizontal comparisons, on the other hand, highlight differences among majors keeping other factors constant. For example, by zooming in on one award level, institution type, or region we can identify the best outcomes by major.
Figure 1 offers an example of horizontal comparison. We first selected all Sub-baccalaureate certificates statewide. Then we ranked majors by "Percent graduates employed in Minnesota during the second year after graduation", and we selected the top 12 programs. For the purpose of this presentation we included only results for programs with more than 50 graduates4.
We can clearly see that vocational certificates fare very well in the Minnesota job market. It is surprising how often trade schools are under-rated and under-promoted with our youth. Programs such as Plumbing and HVAC technicians are short-term and therefore more attainable for the average person in the workforce, and they pay well. These comparisons also help us understand the degree of alignment between the state's educational offerings and employers' needs. Since high employability of graduates means successful alignment, we know that programs in these areas are effectively meeting the needs of Minnesota employers.
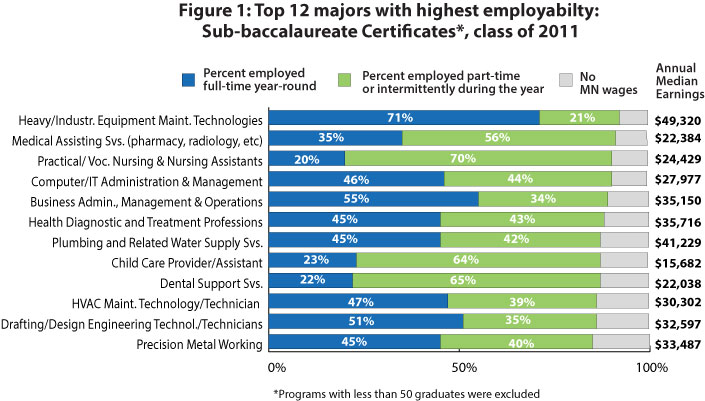
Figure 2 presents the same ranking for Associate Degree programs. Interestingly, there is a high degree of overlap between the programs in Figure 1 and those in Figure 2. Again we find Health Care, IT, Engineering, and skilled trades (HVAC, Industrial and Manufacturing Engineering Technicians, and Precision Metal Working) on top of the list with employment rates ranging from 85 to 90 percent. These are occupational or technical programs, i.e., they address a focused career field just as certificates do. For example, Electromechanical Instrumentation and Maintenance programs train people in cutting edge technologies such as automation, robotics, and biomedical.
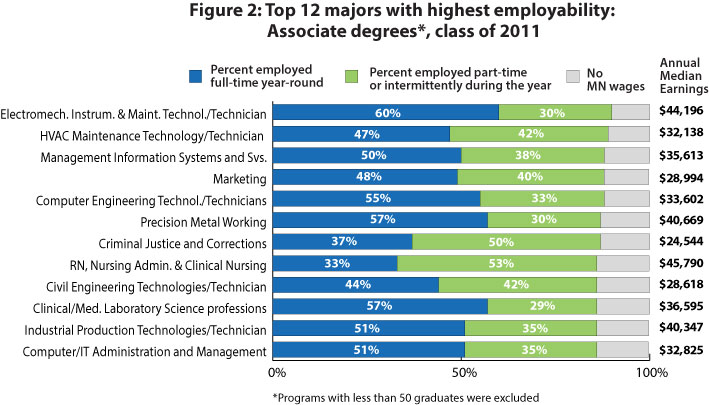
What do these similarities mean? Clearly there are more opportunities within Minnesota for people trained to work in these careers. Even though employment is not necessarily in an occupation associated with the students' award discipline, the skills sets acquired at school in these disciplines are quite marketable5.
However, these successful programs also differ in important ways. First of all, the market value of the credentials they offer vary dramatically, with wages ranging from $15,682 in Child Care Provider/Assistant6 Certificates (predominantly one-year in length)7 to $49,320 in Heavy/Industrial Equipment Maintenance Technologies Certificates (three-years length). Second, the blue-colored bars show huge variation in the share of graduates working fulltime year-round, which is an indicator of job quality. Nursing offers a striking example of very high employability (90 percent for Practical Nursing Certificates and 87 percent for RN Associate Degree programs), yet very low fulltime continuous employment (20 percent for Certificates and 33 for Associate Degree holders).
In cases like these, where a program does well in one area but not so well in another, it is up to users to decide what matters most to them. Are employability prospects immediately after graduation most important, or is fulltime stable employment equally relevant? Earning prospects are also a powerful motivation to pursue a degree and major. Since programs that score highly on all success metrics are rare, users of these data are encouraged to start from the areas in which they already have an interest and look at the options that offer a well-balanced mix of outcomes.
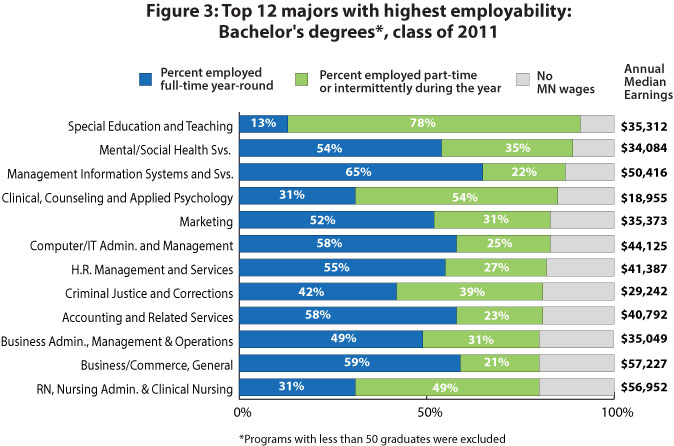
Figure 3 shows the top ranked Bachelor's Degree programs, which include Health Care Service professions, IT, Marketing, and Business Support Services such as Human Resources and Accounting.
It is noteworthy that the major with the highest employment rate, Special Education and Teaching at 91 percent, offered very little full-time year-round employment, only 13 percent. This reflects the lack of formal summer hours in most teaching jobs. Psychology also had high retention rates but did not guarantee a stable and full-time job, at least in the short term.
We can also see that graduates in some fields (nursing, IT, marketing, business administration and others) can successfully find jobs with either a four-year or a shorter term award because employers value various types of credential. There are clearly multiple paths into the job market for these high-demand fields.
When it comes to wages, Engineering and Technology disciplines showed the highest payoffs at every education level (see Figure 4). Also skilled trades such as Industrial Mechanics and Maintenance Technology, Plumbing, Building Maintenance, and Precision Metal Working fared well.
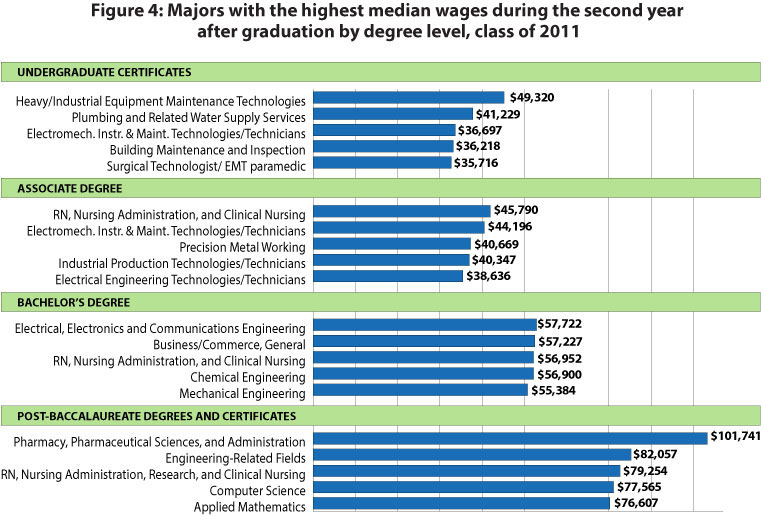
Although most of these high-pay majors are in STEM, the "S" of Science and the "M" of Math are most rewarding at the advanced degree level while the "T" of Technology and the "E" of Engineering are lucrative at every award level. This creates opportunities for individuals who do not want to commit to three or four years of schooling. Also, it must be noted that these high wages are more typical of the Twin Cities labor market than the Greater Minnesota labor market. When the same ranking is applied to the population of students who graduated in Greater Minnesota we see fewer STEM fields and more Health Care and Education-related fields among the highest paying majors.
In conclusion, the choice of major is the key to economic success after graduation. Since college is a more costly investment now than it used to be, it is important to choose a major with an eye toward career paths and labor market trends in Minnesota. Focusing too much on picking a school and too little on career exploration prior to committing to a major can make it more challenging to find a job that utilizes your degree.
Even though we have no information on the types of occupations graduates were employed in, the tool displays a detailed breakdown of industries of employment, giving an idea of the types of firms that are more likely to employ individuals with credentials in each area. Looking up this information can be very useful for someone who might wonder if certain degrees or majors improve the chances of finding a job in the industries of choice. Furthermore, industry information sheds light on the level of alignment between curriculum offerings and employer needs.
The top industries of employment are, by and large, well aligned with the programs' disciplinary areas. There are, however, a few exceptions. For example, 18 percent of people who graduated from "Audiovisual Communication Technology" programs were employed in Accommodation and Food Services (see Figure 5). Another 18 percent were employed in Retail, some in electronics and appliance stores but many more in grocery stores. Eight percent ended up in Health Care, specifically in Home Health Services and Nursing Care Facilities, and 7 percent in Administrative and Waste Services. Only about 8 percent were employed in the Information sector, specifically in Radio and Television Broadcasting and Telecommunications which are closely related to their degree.
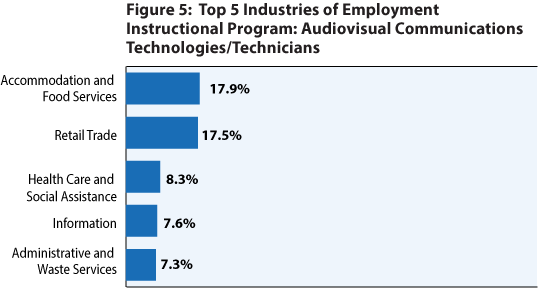
Figure 6 shows an example of perfect alignment: 79.7 percent of new grads in Education programs across the state were employed in the Education sector 24 months after completion.
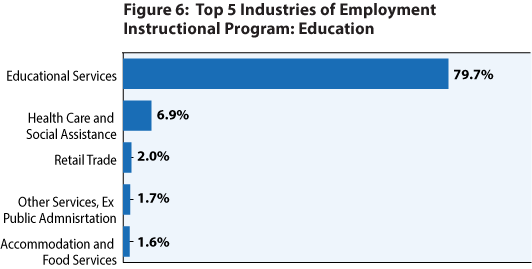
Figure 7 adds more to this picture, showing that the Education sector absorbed 13 percent of all graduates in school year 2010 and 2011, second only to Health Care and Social Assistance.
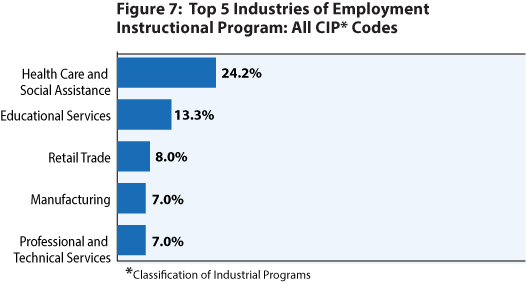
These results demonstrate huge demand for educational services in the state. As much as Minnesotans value and promote investing in the education system, they also would benefit by more transparency and better data to evaluate its effectiveness.
While this tool provides meaningful work outcomes, there are limitations on what can be inferred from the data:
These data cannot be used to evaluate the overall return on investment of post-secondary education compared to no post-secondary education because Minnesota does not have the ability to link high school graduate records to workforce records.
Despite these caveats, the information provided by the Graduate Employment Outcomes tool can greatly expand students' choices, encouraging more individuals to get an education beyond high school and revealing areas of opportunities that can help them succeed at school and in the transition to the world of work.
2According to a report from the Institute for College Access and Success (TICAS), students in Minnesota averaged $31,497 in loan debt in 2012, the fourth highest level of debt in the nation.
3Underemployment is not a new phenomenon. According to the Minnesota Job Vacancy Survey, between 35% and 45% of all job openings for the last decade were part-time. However, post-secondary education was required in 50% to 58% of full-time job openings versus 21-24% of part-time job openings, suggesting that post-secondary education increases the chances of finding full-time work.
4This cutoff was applied to avoid displaying results for smaller populations, which tend to be more volatile from year to year.
5For example, someone who found a job in Public Relations after having graduated in Marketing probably utilizes marketing knowledge and skills to some extent.
6The original title is Human Development, Family Studies, and Related Services, but most students completed a program in Child Care Provider/Assistant. This and a few other program titles have been slightly edited for readability.
7Certificate programs have higher wage variability because short-term certificates tend to pay less than three-year certificates.