by Amanda Rohrer
July 2019
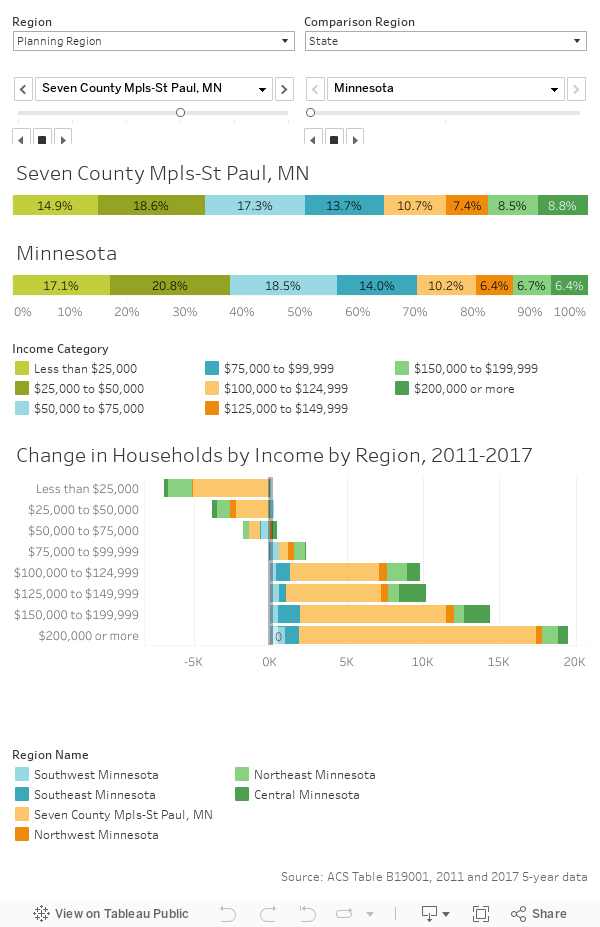
Income inequality is a term that’s showing up more and more places. In a general sense the term refers to the gap between the wealthy and the not-so-wealthy. But where do we draw that line? The wealth of the top 1 percent? The top 5 percent? Earnings over $100,000? Most researchers define these terms in their work, but the statistics reported in headlines never show the complete picture. In the data visualization below Census income data for Minnesota and Minnesota regions are compared with each other and through time. Presenting the information in an interactive feature gives users a better sense of where the changes are occurring and how areas differ. Keep in mind that this is income, not wealth – many reports look as the wealth (assets) of multi-million and billionaires relative the wealth of other populations. This is looking only at income, which is money coming in.