by Dave Senf
June 2023
The pandemic-induced economic damage in 2020 included a record plunge in employment, a tidal wave of initial claims for unemployment benefits, skyrocketing unemployment rates, elevated business closures and robust personal income growth. That's right, robust personal income growth thanks to the extraordinary increase in federal government spending aimed at moderating economic loss related to the COVID-19 pandemic, including government steps taken to mitigate the spread of the virus. Another sharp boost in personal income occurred in early 2021 when another large round of federal pandemic spending spread across the nation.
A number of pandemic-related federal spending bills were passed after COVID-19 emerged, providing funds to keep people afloat as the economy crashed and to support efforts to contain the coronavirus spread. Two bills, the CARES (Coronavirus Aid, Relief, and Economic Security) Act passed in March 2020 and the ARP (American Rescue Plan) Act passed in March 2021, were unparalleled in their scope and size, providing more than $2.3 trillion and $1.9 trillion respectively in funds to combat the virus spread and prop up the battered economy.
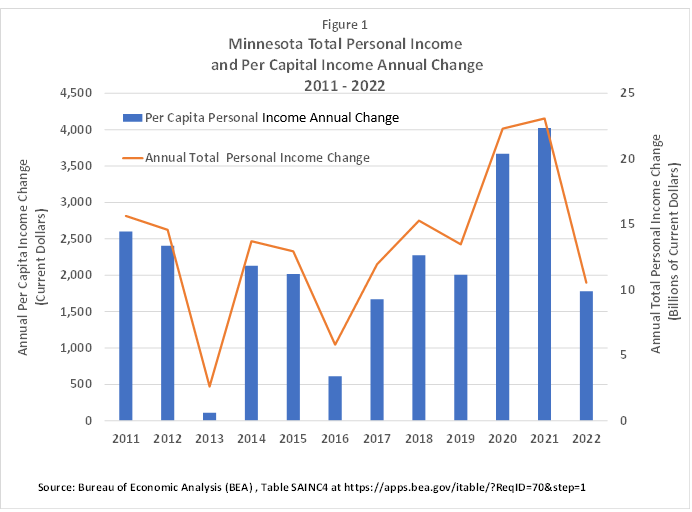
Federal pandemic spending in Minnesota boosted personal per capita income (PCI) by $3,700 (6.3%) in 2021 and $4,000 (6.5%) in 2021 as shown in Figure 1.1 Prior to the federal pandemic relief, the average annual PCI gain was $1,800 (3.6%) between 2011 and 2019 according to the Bureau of Economic Analysis (BEA). PCI growth was cut in half in 2022, dipping to $1,800 (2.8%), as many of the pandemic programs expired or were winding down. Declining income from fading federal pandemic spending over last year has been partially offset by expanding wage and salary income and other income sources as the state's job rebound continued. Increased income from wages and salaries also reduced the number of Minnesotans that qualified for pandemic assistance programs as employment recovered. The state's 2019 to 2022 PCI increase of 16.1% lagged slightly behind the U.S. 16.3% increase.

BEA personal income (PI) and PCI estimates (total personal income divided by population) are widely used to compare economic performance across states and substate areas and to evaluate state economic trends. The BEA has strived to incorporate most of the federal government's pandemic assistance payments to households and businesses into their estimates of personal income. By doing so, we can get a detailed picture of how personal income in Minnesota and across the nation surged during the pandemic despite the economic hurricane created by the COVID-19 virus.

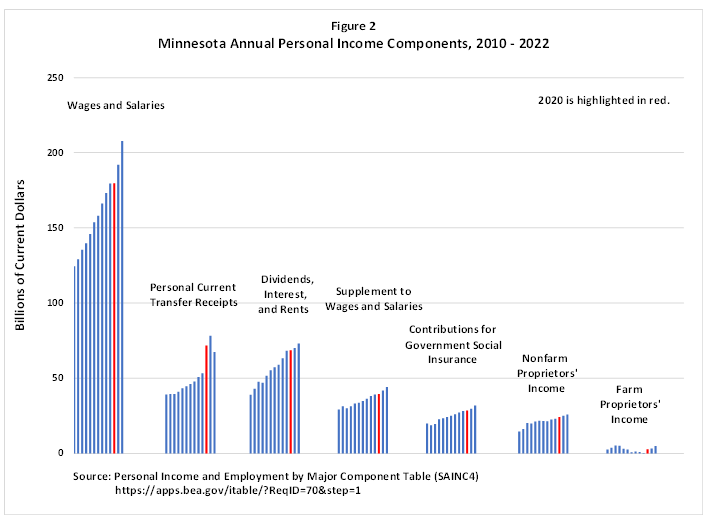
PI estimates are divided into eight major components based on the sources of income streams.2 Minnesota total personal income climbed $22.3 billion (or 6.7%) in 2020 despite income remaining virtually flat across four of the components including the major income source, wages and salaries, which increased by only 0.2%. Proprietors' income, both farm and nonfarm, increased in 2020 (boosted by federal government pandemic programs) but their contribution to spiking income was minimal due to their lower share of total income. Most of the $22.3 billion spike in income in 2020 sprang from the $18.1 billion (33.9%) increase in personal current transfer payments received by Minnesotans during the year.
Personal current transfer receipts increased again in 2021, again boosting Minnesota income. But as the economy recovered from the pandemic the other income components returned to their historical role in fueling income growth. Spiking personal current transfer receipts accounted for 80% of income growth in 2020 and 29% in 2021. The $11 billion drop off in 2022 current transfer receipts cut the $21.5 income increase generated by the other components (including the $15.9 billion increase in wages and salary) in half, resulting in the state's net total personal income climbing by $10.5 (2.8%) in 2022.
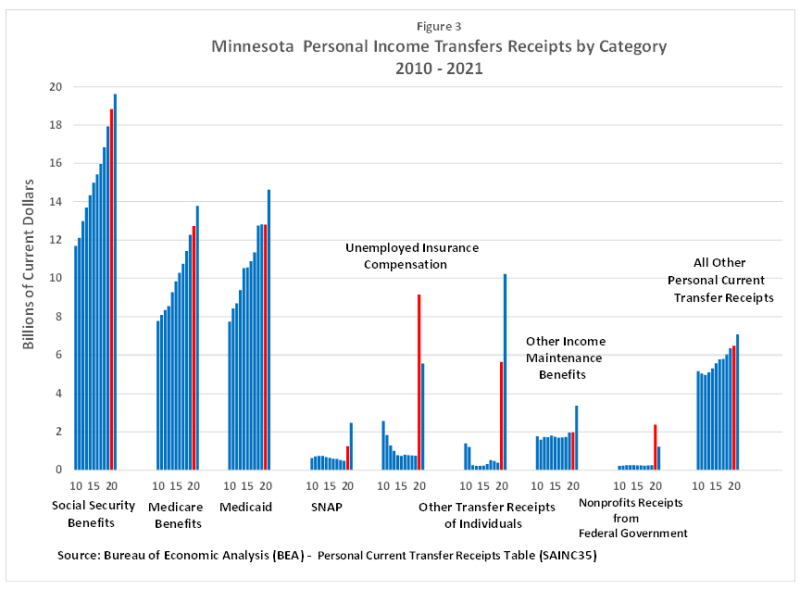
Personal current transfer receipts as reported by the BEA are benefits receive by persons from federal, state, and local governments and from business for which no current serves are performed. Most of the transfer receipts are federally funded. Some transfer payments, like Social Security or unemployment insurance benefits, are received directly by individuals and spent at their discretion (see Figure 3)3. Other transfer payments, like Medicaid and Medicare, are in-kind income where the government pays the bill for services received by individuals. The share of personal income received in Minnesota through transfer payments averaged 16.0% (17.2% for the U.S.) from 2010 to 2019, spiked to 20.1% (21.4% for U.S.) and 20.6% (21.7% for U.S.) in 2020 and 2021, before dipping to 17.3% (17.9% for U.S.) in 2022.

As displayed in Figure 3, Social Security and Medicare benefits continued a long-standing annual increase as the share of the population 65 years and older continues to grow. Detailed data for 2022 has yet to be published. The elevated contribution of personal current transfer receipts to personal income in 2020 can be traced to spikes in:
Besides the personal current transfer receipts spike related to federal pandemic spending that boosted Minnesota personal income in 2020, some CARES related spending boosted proprietors' income as well. Self-employed farm and nonfarm proprietors' PPP loans were added to proprietors' income (not shown in Figure 3 but included in Figure 2). Farm proprietors' income was doubled by funds received by farmers through the Coronavirus Food Assistance Program and the Paycheck Protection Program (PPP) in 2020. The Coronavirus Food Assistance Program provided direct relief to Minnesota farmers ($1.2billion) who faced price declines and additional market cost due to COVID-19. Some Minnesota farmers also participated in the PPP and received an estimated $200 million through that program.
Minnesota nonfarm proprietors also signed up for PPP loans and the BEA estimates that nonfarm proprietors' income was increased by $2.7 billion from participation by self-employed in the program. Without the PPP money being counted in nonfarm proprietors' income in 2020 and 2021 nonfarm proprietors' income would have been below the 2019 level. PPP loans for private business don't directly show up in personal income but instead as business subsidies, which are not included in personal income.
Transfer payments increased again in 2021 funded primarily by the ARP Act, increasing by $6.6 billion or 9.6% (U.S. increase was 9.1%). Some sources of transfer payments declined from 2020 while other sources expanded.
The boost in personal income from pandemic related programs peaked in 2021 as transfer receipts declined by $6.6 billion (9.3%) in 2022 with the decline in federal government pandemic related spending. Some of the pandemic related federal transfer payments will continue through 2024 but most programs have been disbanded. For example, an estimated 15 million Americans who were received Medicaid during the pandemic are being unenrolled during 2023 and most SNAP benefits recipients will see their monthly benefits reduced by $95 to $250.
How much did expanded federal pandemic-related spending, including the CARES Act, ARP Act and other pandemic related spending programs, aid Minnesota's economy relative to the other states over the pandemic? One quick measure is to rank the percent increase in per capita income from 2019 to 2022 across states. Minnesota's per capita income increased 16.1% during the four years compared to 16.3% nationwide. Minnesota's PCI gain was the 25th largest among states, right in the middle of the 50 states.
The data analyzed here is macro level data that aggregates various sources of personal income, thus concealing household and individual income changes. Despite the jump in personal income in Minnesota there are many households and individuals who experienced income decline during the period. Macro level data presents the aggregate picture but has nothing to say about changes in income distribution that likely occurred from the pandemic.
1Personal income data utilized in this article are nominal (or current) dollars, unadjusted for inflation.
2The smallest source of personal income, resident adjustment, is excluded from Figure 2. Resident adjustment accounts for interstate commuting. For more detail on BEA's state personal income estimates.
4PPP loans by specific nonprofits organization and private companies are available. Nonprofits listed at this site include Amherst W. Wilder Foundation in St. Paul, the Animal Humane Society in Minneapolis and the Lutheran Home Association in Belle Plaine.