by Cameron Macht
June 2015
Southwest Minnesota, with a heavy concentration of employment in manufacturing and agriculture, still hasn't recovered all the jobs that were lost in the recession.
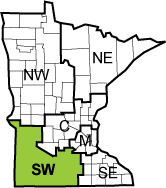
 The 23-county Southwest Minnesota planning region was home to 11,955 businesses and 173,940 jobs during the third quarter of 2014. That was about 6.3 percent of total employment in the state.
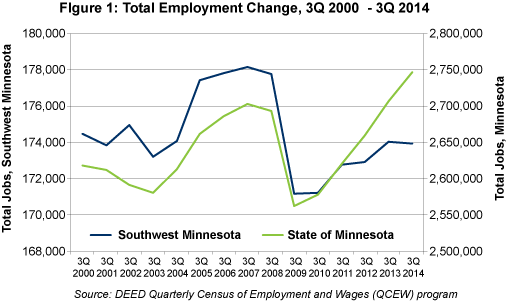
Southwest Minnesota has a much heavier concentration of employment in manufacturing and agriculture than any other part of the state. Like the rest of the state, however, the region has endured some ups and down over the last decade and a half, reaching an employment peak of 178,152 jobs in 2007 before dropping into a deep recession in 2009. In the five years since, the region has been slowly recovering.
While the state regained all of the jobs that it lost during the recession by the third quarter of 2013, Southwest Minnesota still has not climbed back to its pre-recessionary peak employment level. The region has fewer jobs now than it did in the third quarter of 2000.
Southwest Minnesota matched the state's recovery in the first year coming out of the recession, but has struggled with much slower growth since 2011.
Employment data show the state consistently added about 40,000 jobs each year from the third quarter of 2010 to the third quarter of 2014, averaging about 1.6 percent job growth annually.
In contrast, employers in Southwest Minnesota have expanded payrolls in fits and starts, gaining more than 1,500 net new jobs from 2010 to 2011 and almost 1,100 jobs from 2012 to 2013. But the region added just 164 new jobs from 2011 to 2012 and lost about 100 jobs in the past year (see Figure 1).

The region's job fluctuations were spread across several industries, with 14 of the 20 main industries losing jobs during the recession and 13 industries gaining jobs in the recovery. Overall, just eight industries have surpassed their pre-recessionary peaks.
Though manufacturing remains the largest employing industry in the region with more than 32,000 jobs, the sector saw the biggest decline during the recession. Manufacturing lost more than 4,000 jobs from the third quarter of 2007 to the third quarter of 2009. It has regained fewer than 600 of those jobs since then. The largest manufacturing cuts occurred in the printing sector, followed by significant declines in computer and electronic product manufacturing and transportation equipment manufacturing.
Other industries that are struggling to regain jobs include accommodation and food services, construction and wholesale trade. All three would need to gain more than 500 jobs each to get back to 2007 employment levels.
In contrast, the region's health care and social assistance industry added jobs during and after the recession, gaining more than 1,400 net new jobs from the third quarter of 2007 to the third quarter of 2014. Other industries that are in better shape now than before the recession include agriculture, forestry, fishing and hunting; professional, scientific and technical services; and transportation and warehousing (see Table 1).
| Southwest Minnesota Industry Employment Statistics, Q3 2007-Q3 2014 | ||||||
|---|---|---|---|---|---|---|
| NAICS Industry Title | Number of Firms Q3 2014 | Number of Jobs Q3 2014 | Quarterly Payroll Q3 2014 | Recession | Recovery | Total |
| Change in Jobs Q3 2007 - Q3 2009 | Change in Jobs Q3 2009 - Q3 2014 | Change in Jobs Q3 2007 - Q3 2014 | ||||
| Total, All Industries | 11,955 | 173,940 | $1,640,911,093 | -6,988 | +2,776 | -4,212 |
| Agriculture, Forestry, Fishing and Hunting | 581 | 5,010 | $43,699,788 | +82 | +718 | +800 |
| Mining | 27 | 431 | $6,803,471 | -102 | +108 | +6 |
| Construction | 1,527 | 8,934 | $102,807,599 | -1,134 | +457 | -677 |
| Manufacturing | 617 | 32,287 | $360,695,875 | -4,224 | +557 | -3,667 |
| Utilities | 80 | 1,037 | $18,632,503 | +74 | +5 | +79 |
| Wholesale Trade | 653 | 7,820 | $99,479,024 | -197 | -313 | -510 |
| Retail Trade | 1,596 | 20,258 | $109,544,251 | -517 | +523 | +6 |
| Transportation and Warehousing | 763 | 5,797 | $54,750,245 | +33 | +135 | +168 |
| Information | 198 | 2,957 | $31,341,609 | -148 | -61 | -209 |
| Finance and Insurance | 747 | 5,902 | $71,304,895 | -106 | +72 | -34 |
| Real Estate, Rental and Leasing | 297 | 1,285 | $7,762,145 | -159 | +1 | -158 |
| Professional, Scientific and Technical Services | 616 | 4,105 | $48,784,096 | +160 | +300 | +460 |
| Management of Companies | 51 | 1,857 | $94,085,821 | -208 | -19 | -227 |
| Admin. Support and Waste Management Services | 357 | 4,296 | $29,686,087 | -780 | +384 | -396 |
| Educational Services | 227 | 11,470 | $117,811,809 | -109 | +80 | -29 |
| Health Care and Social Assistance | 980 | 30,459 | $273,347,469 | +1,115 | +312 | +1,427 |
| Arts, Entertainment and Recreation | 235 | 2,226 | $8,085,185 | -63 | -14 | -77 |
| Accommodation and Food Services | 836 | 12,639 | $39,444,840 | -649 | -217 | -866 |
| Other Services | 996 | 4,944 | $30,559,802 | -214 | -98 | -312 |
| Public Administration | 571 | 10,219 | $92,284,579 | +277 | -157 | +120 |
| Source: DEED Quarterly Census of Employment and Wages (QCEW) program | ||||||
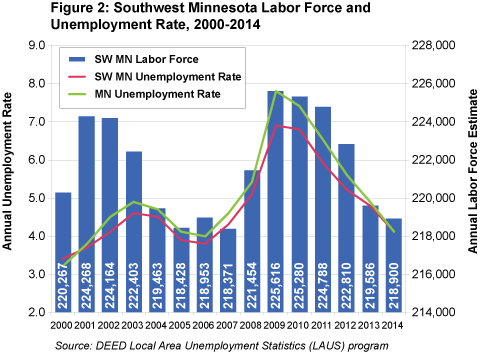
Like the economy overall, the region's unemployment rate and labor force have expanded and contracted over the last 15 years. Southwest Minnesota, however, has consistently had a lower unemployment rate than the rest of the state, including 13 of the last 15 years. Despite the job losses and a slower recovery, unemployment rates remained lower in Southwest Minnesota during the recession, before matching the state rate at 4.1 percent in 2014 (see Figure 2).

Like the unemployment rate, the size of the labor force in Southwest Minnesota has also experienced ups and downs over the past 15 years. Southwest Minnesota's labor force grew at the beginning of the decade, dropped off due to the region's economic strength until 2007, then jumped in size as workers entered the labor force to make up for the lost income from layoffs during the recession.
Since then, while the state's labor force continued growing, Southwest Minnesota's labor force has been declining - dropping from a peak of 225,616 workers in 2009 to a low of 218,900 workers in 2014, which was about 1,400 fewer workers than the region started with in 2000.
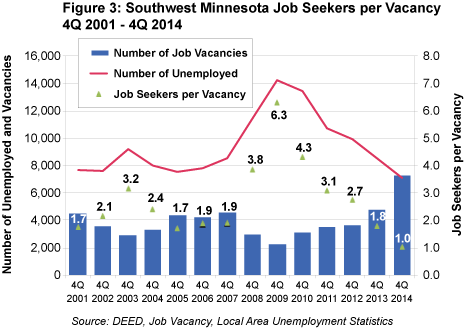
As the number of available workers has declined and the economy continues to recover, the region's labor market has tightened. One clear demonstration of this is the ratio of unemployed job seekers per vacancy, which now stands at 1-to-1 in Southwest Minnesota.
According to DEED's Job Vacancy Survey in the fourth quarter of 2014, there were 7,245 job vacancies reported by employers compared with 7,104 unemployed job seekers in the region. The number of job seekers per vacancy climbed as high as 6.3 in the depths of the recession in 2009, then steadily inched back down before essentially evening out in the fourth quarter of 2014 (see Figure 3).

Going forward, employers will have to compete for available workers in the region to fill open jobs and continue to grow. Even as new workers enter and older workers remain, Southwest Minnesota's labor market will remain tight.