by Dave Senf
November 2013
During the Great Recession many Minnesota businesses were forced to make tough decisions to bring costs in line with waning revenue. Since labor costs - that is, paychecks - are the largest cost for most businesses, companies were forced to cut labor costs quickly either by laying off employees, cutting employee hours or reducing wages. Labor costs were also chopped by cutting benefits such as health care or scaling back matching retirement contributions.
No consistent source of data covers benefits provided by Minnesota employers which could be used to assess how benefits have fared over the last five years. But there are monthly data covering employment, hours, and earnings in Minnesota's Private Sector that are useful for looking at how Minnesota companies trimmed labor costs during the Great Recession and how private employment, hours, and earnings have rebounded over the last few years. The data are part of the Current Employment Statistics (CES) survey which, since 2007, has reported average weekly hours and average hourly earnings for all employees in Minnesota's Private Sector as well as the more commonly reported count of private employment. Previous to 2007, CES reported hours and earnings data only for production workers in the Goods-Producing sector. The new all-employee hours and earnings series is more comprehensive and useful for keeping track of Minnesota's economy.
In Minnesota CES surveys about 6,000 business locations monthly. CES estimates get benchmarked or revised once a year using actual employment counts as reported by the Quarterly Census of Employment and Wage (QCEW) program. QCEW is compiled from administrative reports for every employer covered by Unemployment Insurance (UI) in Minnesota. Employers report quarterly and the data take a couple of months to compile. As a result, QCEW data are published with a lag of roughly six months. About 97 percent of all wage and salary employment is covered by the QCEW series.1
To return to the Great Recession story, Minnesota's private companies' first labor cost-cutting move was to reduced hours when sales slowed as the recession began to take hold in early 2008 (Figure 1)2. Layoffs followed a few months later as the economy continued to nosedive. The average private workweek in Minnesota dropped from 33.8 hours in early 2008 to a low of 32.6 by early 2010, a decline of 3.4 percent in the workweek. Private employment dropped even more, declining 6.0 percent during the recession. Employment began to slip in the middle of 2008 and continued to decline through the middle of 2010. Minnesota's private workweek began its slow turnaround roughly six months before employment began rebounding. Average weekly hours in the Private Sector appear to be a leading indicator of private employment just as average weekly hours in Manufacturing have historically been a leading indicator of overall job growth.
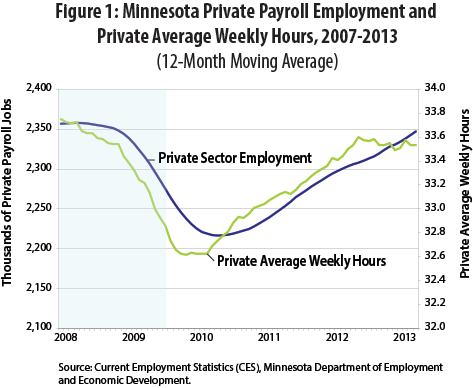
The workweek gradually increased from 2010 through 2012 but has flatlined since and is still slightly under pre-recession levels. Minnesota's average private workweek may have been permanently lowered by the Great Recession, reflecting a change in the state's industry mix over the last five years. Manufacturing and Construction jobs, which historically have longer workweeks than most other industries, make up a smaller share of employment in 2013 than in 2007.
Most of the Construction and Manufacturing job loss has been made up by expanded Educational and Health Services payroll numbers. Average workweeks for Construction and Manufacturing workers in Minnesota were 39.8 and 40.1 hours in 2012. The average workweek for Educational and Health Services workers is much shorter, averaging 30.9 last year.
Employment also gradually rebounded during the first three years after the recession but, unlike average hours worked, has continued to rebound in 2013. Private employment has essentially rebounded to pre-recession levels in 12 of 17 private sectors. Manufacturing, Construction, Retail Trade, Information, and Wholesale Trade payroll totals are still below pre-recession totals.
Private Sector aggregate weekly hours, defined as the product of private employment and average weekly hours of all private workers, declined 9.0 percent during the recession (Figure 2) as falling average weekly hours and declining employment combined to push down aggregate weekly hours. Shorter average weekly hours accounted for roughly 35 percent of the drop in aggregate weekly hours while job cuts accounted for 65 percent.
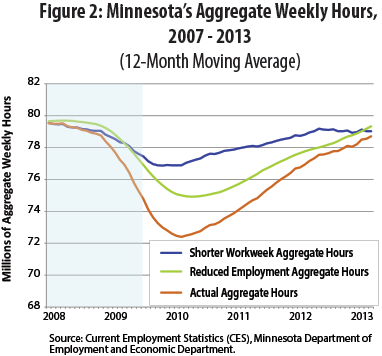
The loss of 142,000 jobs translates into a loss of roughly 4.7 million hours per week, given a 33.8 hour workweek. A drop in average weekly hours from 33.8 hours to 32.6 hours spread across the 2.2 million private employees that remained employed through the recession adds up to 2.7 million hours of work lost per week. The 2.7 million hours lost from a shorter workweek are equivalent to roughly 79,000 jobs when the average workweek is 33.8 hours. In other words, Minnesota's job loss might have been 79,000 jobs higher if not for the reduction in average weekly hours.
As shown in Figure 2, Minnesota's aggregate work hours per week totaled just below 80 million going into the recession in early 2008. The loss of work hours related to the decline in average weekly hours is shown in the top line, Shorter Workweek Aggregate Hours. Work hours lost from job cuts is shown in the middle line, Reduced Employment Aggregate Hours. The combined aggregate weekly hour loss is shown in the bottom line, Actual Aggregate Hours. Aggregate hours bottom out around 72.4 million hours and have rebounded to 78.7 million hours a week as of August 2013. That is just below the 79.5 million weekly hours reached before the recession kicked in.
At the start of the recession aggregate weekly hours for Minnesota's Goods Producing Sector (Mining, Construction, and Manufacturing) accounted for nearly 24 percent of the state's total aggregate weekly hours. Goods Producing aggregate weekly hours slipped from 18.9 million at the start of the recession to as low as 14.8 million in 2010 before partially rebounding to the current 16.4 million hours (Figure 3). Goods Producing hours now account for 21 percent of the state's total aggregate weekly hours. Average weekly hours were cut 5.7 percent during the recession but are nearly back to their pre-recession level as of August. Employment, however, remains 12.7 percent below the December 2007 level after declining 17.5 percent during the recession.
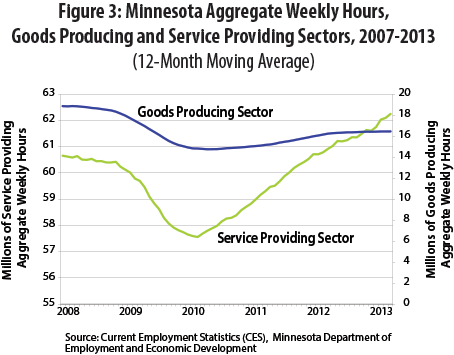
Average weekly hours in the Service Providing Sector were reduced by 2.6 percent during the recession while employment dropped by 3.1 percent, pushing aggregate weekly hours in the service providing sector down from 60.7 million when the recession started to a low of 57.6 million during the recession. Average weekly hours in the Service Providing Sector are now back to pre-recession levels and employment has increased beyond the pre-recession total. As a result Service Providing aggregate weekly hours reached 62.2 million hours in August, 2.6 percent more than before the recession (Figure 3). Goods Producing companies relied more heavily on layoffs than Service Providing companies to trim their labor costs. Service Sector employers were more likely to shorten the workweek and maintain their payroll employment.
The third option companies turned to during the recession to rein in labor costs was to hold the line on wages. Average private hourly earnings surprisingly increased during the recession, climbing from $23.00 per hour to $23.50 between 2008 and 2009. Perhaps pay increases were already set in late 2007 and early 2008 before the full extent of the recession was realized. Pay bumps were few and far between, however, for the next year or so as hourly earnings held steady at $23.50 from the second half of 2009 to the second half of 2010. Average hourly earnings have climbed 8.4 percent since the middle of 2010 increasing from $23.50 to $25.50 (Figure 4).
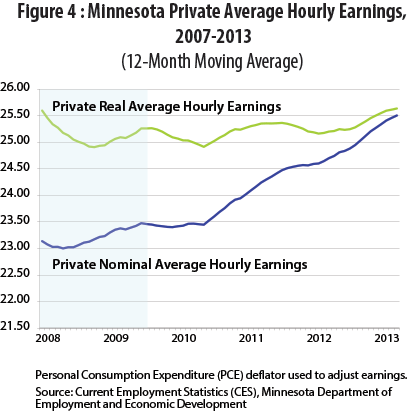
The $2.00 gain in private sector hourly pay over the last three and a half years was the nominal gain before adjusting for inflation. After adjusting for inflation, using the Personal Consumption Expenditures (PCE) index, private average hourly earnings have been relatively flat since the onset of the recession. Real average hourly earnings in the private sector currently are just 2.5 percent higher than in mid-2010 and roughly the same as five years ago at $25.60. Labor costs were definitely held down in real terms as evidenced by flat real hourly earnings over the last five years.
An aggregate private paycheck for Minnesota's private sector workforce can be estimated by taking employment X average workweek X average hourly earnings. The estimates are shown in Figure 5 both in nominal and real terms. The 2.3 million workers employed in Minnesota's private sector have been hauling in a combined or aggregated $2.0 billion each week since June.
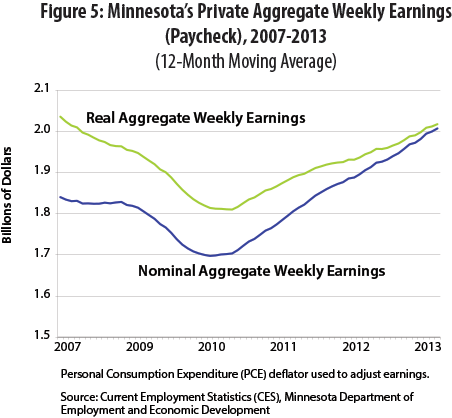
Minnesota's aggregate weekly real private paycheck as of August is still 0.9 percent short of its pre-recession peak but has been making steady albeit gradual progress after hitting bottom in 2010. Job layoffs, fewer work hours, and stagnant real hourly pay combined to shrink the aggregate weekly private paycheck by 12.5 percent during the recession. Job growth, more average weekly hours, and a recent uptick in real hourly earnings have combined to push private pay levels close to pre-recession level.
The private paycheck estimate provided by the CES survey's monthly nonfarm private wage and salary employment, average weekly hours, and average hourly earnings is the first available estimate of the most important component of Minnesotans household income. Private nonfarm wage and salary payments accounted for 47 percent of Minnesota's personal income as measured by the Bureau of Economic Analysis (BEA) during the second quarter of 2013.3 The most comprehensive measure of private wages and salaries comes from the QCEW which has a lag of six months.
Figure 6 traces how aggregate private earnings or paychecks generated by the monthly CES data compares to the aggregate private earnings or paychecks from the QCEW program. The data is displayed quarterly since QCEW data is reported quarterly and has not been adjusted for inflation. The CES private paycheck has averaged 10 percent less than the QCEW private paycheck since 2007. Some of the difference is related to how bonuses are treated in the two programs. Bonuses, unless paid out weekly or monthly, are excluded in the CES's weekly hourly earnings estimate. All bonuses get included in QCEW wage and salary payment data. The remaining difference is probably just from surveying errors inherent in the CES survey.
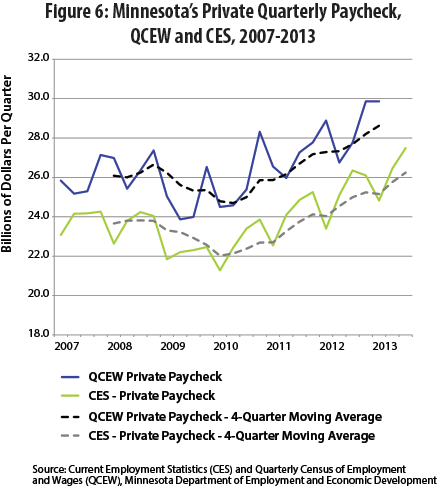
The good news is that the CES aggregate earnings have climbed 10 percent between the first quarter and third quarter this year. That jump is a positive indicator that household incomes in the state have continued to rebound over the last six months. Check back in six months when the QCEW paycheck for the third quarter is reported to verify the upward trend in household income indicated by the CES private paycheck.
1For more information on CES average weekly hours see "Coming Up Short", Minnesota Economic Trends, December 2010 and "Changes in Current Employment Statistics", Minnesota Economic Trends, June 2010.
2Six years of data (2008-2013) are not a long enough series to establish a seasonal adjustment pattern. Twelve-month moving averages were used to smooth out seasonal fluctuations.