View: Home | Data Tool | About | Outcomes by Race | Glossary | Methodology | LMI Help
The dashboard below presents four main indicators of racial disparities in labor market outcomes after completing a post-secondary credential in Minnesota:
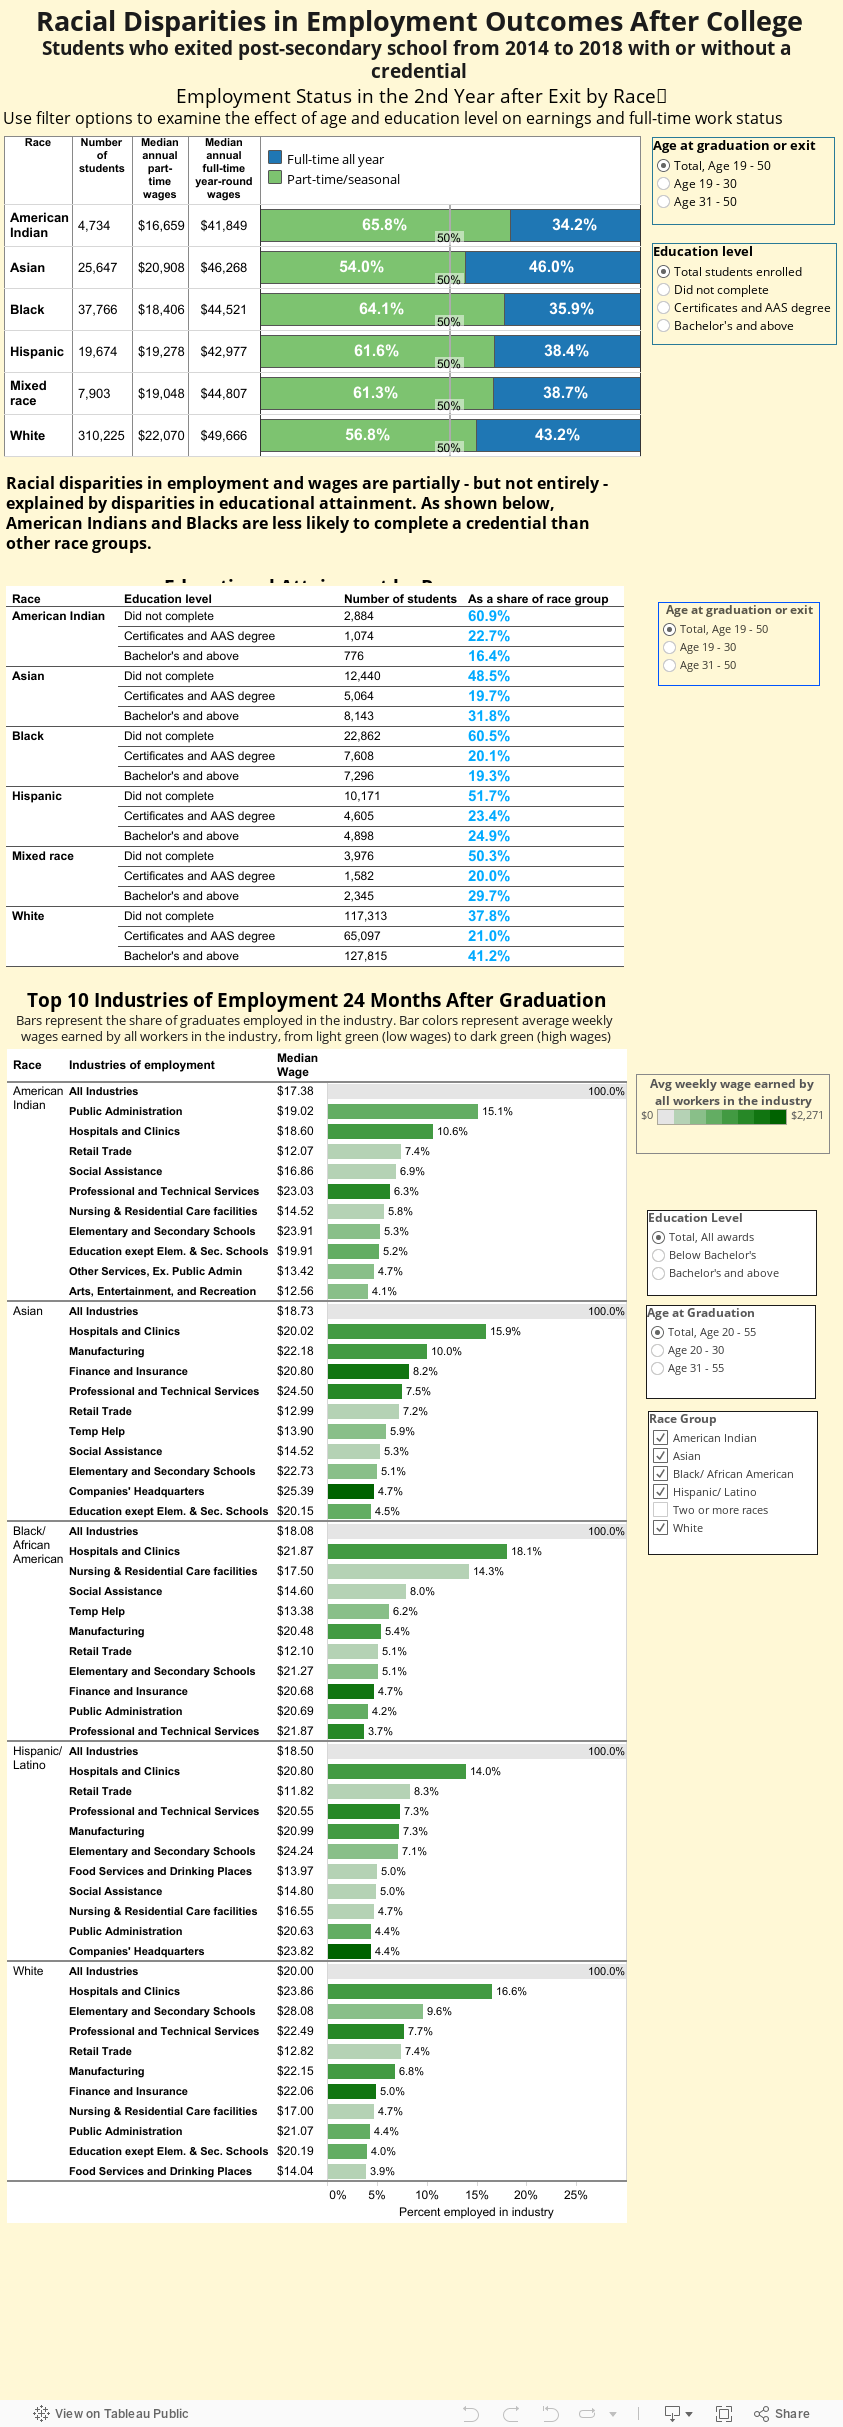
Use the check boxes on the dashboard to filter by education level and age group in order to isolate the effect of race from the effect of educational attainment and work experience/age.
To explore this topic in more detail see the article by A. Leibert in Economic Trends magazine, December 2015, or her article in Minnesota Employment Review, July 2016
Race/ethnicity is a self-reported category that includes the following options: Black or African American, American Indian or Alaska native; Asian; Hispanic/Latino; White; Native Hawaiian or Other Pacific Islander; Two or more races; Nonresident Alien. Native Hawaiian or Other Pacific Islander were excluded from the dashboard display due to the very small size of this group. Nonresident aliens were excluded because the category is not descriptive of a racial or ethnic status. Moreover, a high percentage from this group leave the state after graduation skewing employment status results. Asians include a broad spectrum of ethnic groups but the categories that students can select from do not provide any more detailed breakdown.
Part-time/seasonal employment represents individuals who were either employed for part of the year (less than four quarters) or worked a total of less than 1,820 hours during the year in their primary job.
Full-time year-round employment represents individuals who were employed all four quarters of the year for a total of at least 1,820 hours in their primary job. It does not include individuals who hold multiple jobs totaling 1,820 hours over four quarters.
Unknown employment status represents the share of graduates who did not have any record of employment in Minnesota during the 2nd year after graduation. Individuals who are self-employed, employed out of state, unemployed and actively seeking work, or voluntarily not seeking work are not represented in Minnesota wage records.
Top 10 Industries of Employment 24 Months After Graduation represent the top 10 industries in which program graduates from the selected graduation years have found employment. Industries were classified according to the North American Industry Classification (NAICS) system. Industry is not equivalent to occupation. For example, the manufacturing industry employs persons in the occupations of machinist, manager, and administrative support. However, industry is the best available indicator of alignment between program of study and job after graduation.
Author’s calculations from SLEDS (Statewide Longitudinal Education Data System). Graduates who earned more than one degree were classified according to the highest degree obtained. Wage data have been adjusted for inflation based on the federal Consumer Price Index, with the purpose of allowing comparisons over time.
