by Dave Senf
October 2017
Note: All data except for Minnesota’s PMI have been seasonally adjusted. See the feature article in the Minnesota Employment Review, May 2010, for more information on the Minnesota Index.
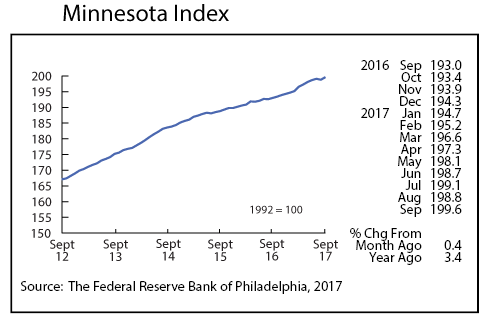
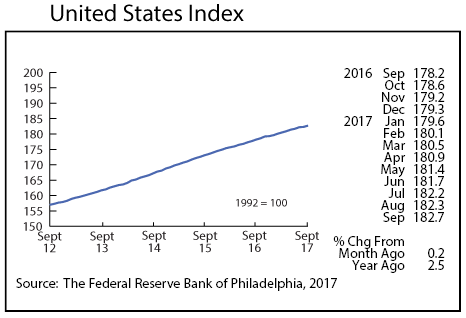
The Minnesota Index rebounded from its drop in August by increasing 0.4 percent in September, the largest monthly jump since May. The rebound was fueled by an uptick in wage and salary employment, a drop in the unemployment rate, and climbing wage disbursements. Minnesota’s index outpaced the U.S. index for the sixth time this year as the U.S. index advanced 0.2 percent.
Minnesota’s unadjusted unemployment rate dropped to a 17-year low of 2.9 percent in September. Another year of even moderate job growth will generate extremely tight labor markets last experienced in the state in 1998 and 1999. Minnesota’s index has advanced 3.4 percent over the year compared to the U.S. increase of 2.5 percent.
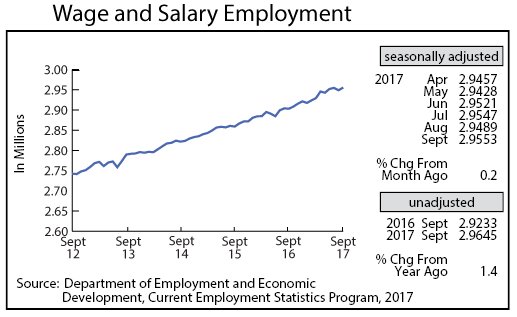
Minnesota’s adjusted Wage and Salary Employment bounced back from a loss of 5,800 jobs in August with a gain of 6,400 jobs in September. Private sector payrolls were up 4,700 while public sector jobs increased by 1,700. Job loss was confined to three sectors with Information and Leisure and Hospitality cutting employment the most. Professional and Business Services, Educational and Health Services, plus Government and Other Services expanded payrolls the most.
Minnesota’s unadjusted over-the-year job growth fell to 1.4 in September but once again surpassed the U.S. rate which was held to 1.2 percent by hurricanes. Minnesota’s over-the-year growth has been higher than the national rate for the last five months. This is the longest monthly string of above-the-U.S. rate since 2011. Minnesota’s monthly job growth, on a year- over-year basis using unadjusted job numbers, has been faster than the U.S. growth 57.6 percent of the time with data going back to 1950.
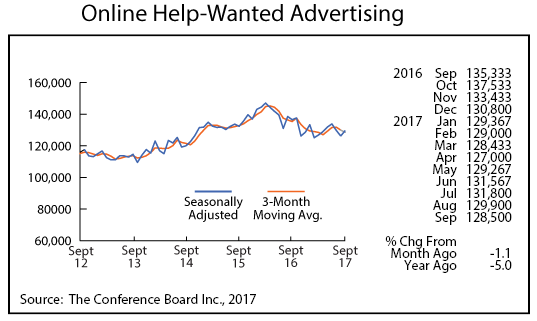
Online Help-Wanted Ads reversed a two month trend of decline in September increasing by 2.7 which topped the nationwide 0.1 percent increase. The Conference Board, which publishes the online job postings data, also calculates a supply/demand ratio for states which compares unemployed workers to online help-wanted ads. Minnesota’s ratio was .87, the third lowest behind Colorado (.66) and North Dakota (.68).
A ratio of 1.0 implies that for every unemployed worker there is an online help-wanted ad. A ratio below 1 implies that there are more online help-wanted ads than unemployed workers. The U.S. rate is 1.52. Hawaii and New Hampshire are the two other states that have a supply/demand ratio below 1.0. Louisiana and Kentucky have the highest ratios with 2.91 and 2.63 respectively.
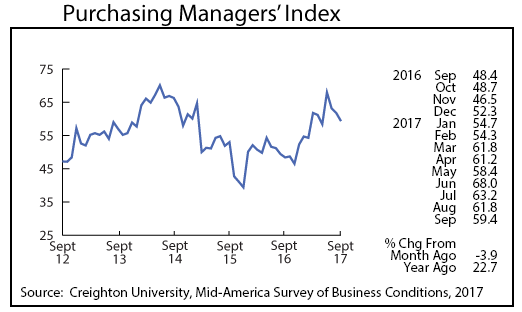
Minnesota’s Purchasing Managers’ Index (PMI) dipped for the third month in a row to a still solid 59.4. The average is 54.0 over the 23-year history of the PMI. A reading above 50 suggests manufacturing activity in the state is expanding. The corresponding national index rose to 60.8, its highest reading since 2004. The Mid-American index also advanced, ticking up to 58.2.
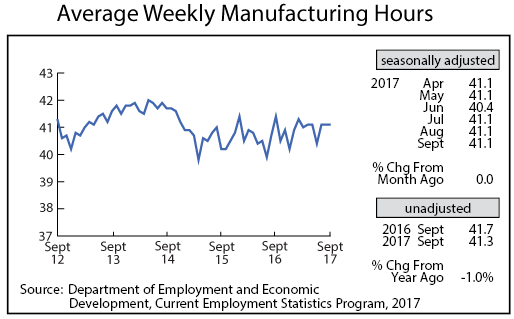
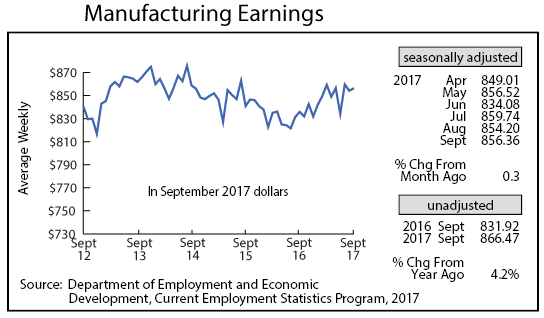
Adjusted Manufacturing Hours remained unchanged for the third straight month at 41.1 hours per week. Average weekly Manufacturing Earnings, however, inched up to $856.36. Look no further than the 2.6 percent average over-the-year increase in factory earnings through September for evidence of the 2017 rebound in Minnesota manufacturing.
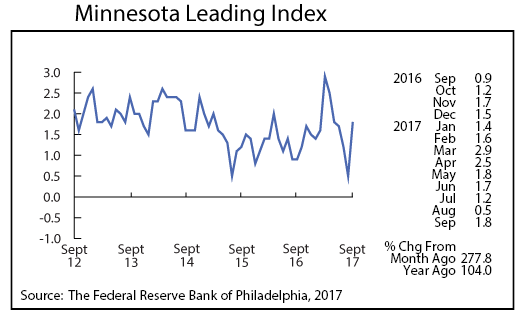
The Minnesota Leading Index, after hitting a two-year low last month, rebounded strongly in September, climbing to 1.8. The average reading since 1982 is 1.5, so the September reading points toward above average economic growth in Minnesota over the next six months.
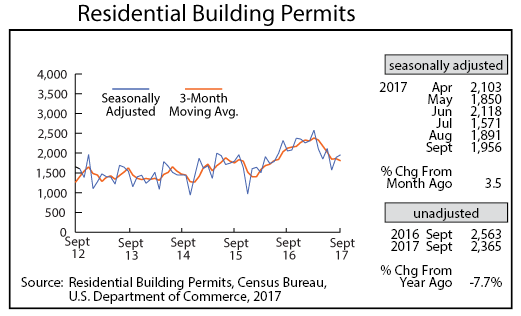
Adjusted Residential Building Permits edged up in September to 1,956 but continue to remain below higher levels recorded earlier in the year. Fewer apartment building permits are being filed, suggesting that the apartment building boom has probably reached its peak. Home-building will be up in 2017 compared to 2016, but the promise of a break out year early in the year looks to have faded away.
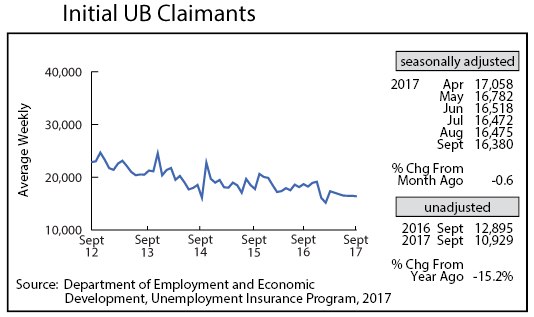
Adjusted Initial Claims for Unemployment Benefits (UB) dipped slightly in September to 16,380, the lowest level since January. Total initial claims are headed for the lowest annual total since 2000. The low initial claims level is a reflection of low layoff rates. Employers are having enough problems finding workers to hire, so they are hanging on to their workforce. Minnesota’s unadjusted average monthly over-the-year job growth through the first nine months of 2017 is 1.8 percent. That tops the U.S. rate of 1.5 percent and all of the neighboring states – Iowa (0.9 percent), North Dakota (0.7 percent), South Dakota (1.1 percent), and Wisconsin (1.0 percent).
