by Rachel Vilsack
November 2013
Four years after the end of the Great Recession, Minnesota has regained all private sector jobs lost. The region driving the job gains, especially over-the-year increases in 2013, is the Minneapolis-St. Paul metro. While broad regional numbers are positive, employment in individual cities has fared differently. Which cities have recovered? What distinguishes their success?
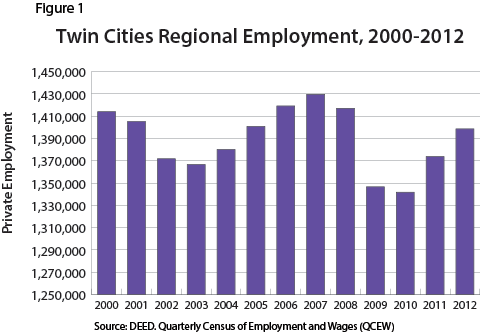
Private sector employment averaged 1,398,637 in the Twin Cities region in 2012 (Figure 1). The region is still off 31,070 jobs from the highest annual employment over the past 12 years which was in 2007, the year the Great Recession began. But the number of jobs has increased since 2010, growing 2.4 percent in 2011 and 1.8 percent in 2012.

Annual average employment for 2007 and 2009 will define the jobs lost during the recession. Officially the Business Cycle Dating Committee at the National Bureau of Economic Research (NBER) dates the recession as beginning in December 2007 and ending in June 2009. At 18 months the 2007-2009 recession was the longest in the post-World War II period. In the Twin Cities region losses between 2007-2009 numbered 83,058 jobs, a decline of 5.8 percent.
Employment declines in 2010 should be expected and may be the result of local industry mixes. As the Construction and Manufacturing sectors suffered the largest job losses during the recession, areas with employment concentrated in these industries may have continued to suffer.
Recessionary employment trends varied in severity in the seven Twin Cities counties. Anoka, Scott, and Washington counties suffered the largest percentage decline in jobs between 2007 and 2009. The largest numeric decline in employment was in Hennepin County, where private sector employers shed 44,691 jobs between 2007 and 2009 (Table 1). Anoka County, in particular, has a strong concentration of employment in the Goods-Producing sector: About one in three jobs in the county were in the Construction or Manufacturing sector in 2007.
| Private Employment by County, 2007-2012 | ||||||||
|---|---|---|---|---|---|---|---|---|
| County | 2007 | 2009 | Numeric Change, 2007-2009 | Percent Change, 2007-2009 | 2011 | 2012 | Numeric Change, 2007-2012 | Percent Change, 2007-2012 |
| Anoka County | 100,673 | 92,091 | -8,582 | -8.5% | 92,641 | 96,425 | -4,248 | -4.2% |
| Carver County | 28,650 | 27,524 | -1,126 | -3.9% | 28,346 | 29,318 | 668 | 2.3% |
| Dakota County | 156,723 | 149,435 | -7,288 | -4.7% | 151,312 | 154,301 | -2,422 | -1.5% |
| Hennepin County | 766,242 | 721,551 | -44,691 | -5.8% | 741,206 | 756,180 | -10,062 | -1.3%. |
| Ramsey County | 279,871 | 265,528 | -14,343 | -5.1% | 265,724 | 266,886 | -12,985 | -4.6% |
| Scott County | 33,395 | 30,925 | -2,470 | -7.4% | 32,210 | 32,352 | -1,043 | -3.1% |
| Washington County | 64,157 | 59,598 | -4,559 | -7.1% | 62,413 | 63,174 | -983 | -1.5% |
| Source: DEED, Quarterly Census of Employment and Wages (QCEW) | ||||||||
Only Carver County had a 2012 employment level at or above their 2007 level, suggesting a full recovery from the recession. Carver County was the least impacted county during the recession, losing 3.9 percent of private sector jobs in 2007-2009. One in three jobs in Carver County was in the Manufacturing sector in 2007, which stands in contrast to trends seen in Anoka County. At 12,985 Ramsey County has the largest number of jobs to gain back in order to see pre-recessional employment levels, while Hennepin County needs to gain back 10,062 private sector jobs.
According to 2012 population estimates from the State Demographer's Office, there are 193 cities and townships in the seven-county Twin Cities region.1 Combining this list with jobs data from the Quarterly Census of Employment and Wages (QCEW) yields 168 city and township matches using the 2007 and 2009 recession time frame definition. Cities that didn't have data available in the years studied were excluded from the analysis.
In total, private employment in 48 out of 169 cities and townships of the Twin Cities, or 28.4 percent, experienced job increases during 2007-2009. Table 2 lists the cities and townships, grouped by county, according to their percentage growth in private sector employment.
| Table 2: Cities by Percent Private Sector Employment Growth During the Recession, 2007-2009 | ||||||
|---|---|---|---|---|---|---|
| Anoka County (21) | Carver County (18) | Dakota County (30) | Hennepin County (42) | Ramsey County (16) | Scott County (16) | Washington County (25) |
| Columbus (36.2%) | Young America Township (7.9%) | Eureka Township (144.2%) | Hassan Township (69.0%) | Mounds View (82.3%) | Elko New Market (68.0%) | Mahtomedi (116.6%) |
| Lexington (15.9%) | Waconia (7.5%) | Mendota (111.3%) | Dayton (44.4%) | North Oaks (25.8%) | Jackson Township (50.9%) | Oak Park Heights (57.7%) |
| St. Francis (11.9%) | Hamburg (6.1%) | Greenvale Township (33.8%) | Independence (23.8%) | Gem Lake (11.8%) | Sand Creek Township (17.6%) | Lake St. Croix Beach (10.5%) |
| Hilltop (5.7%) | Dahlgren Township (6.0%) | Coates (33.8%) | Deephaven (14.5%) | Falcon Heights (6.1%) | Credit River Township (14.4%) | Willernie (4.1%) |
| Oak Grove (5.3%) | Watertown Township (5.6%) | Randolph Township (16.7%) | Orono (10.6%) | - | Belle Plaine (3.5%) | Forest Lake (2.9%) |
| Andover (4.1%) | Victoria (1.2%) | Vermillion (13.3%) | Shorewood (9.5%) | - | - | - |
| - | Chanhassen (0.4%) | Lilydale (5.9%) | Golden Valley (4.2%) | - | - | - |
| - | - | Mendota Heights (5.5%) | St. Anthony (2.2%) | - | - | - |
| - | - | Rosemount (3.8%) | Robbinsdale (2.0%) | - | - | - |
| - | - | South St. Paul (1.4%) | - | - | - | - |
| - | - | Waterford Township (0.9%) | - | - | - | - |
| - | - | Miesville (0.9%) | - | - | - | - |
| Numbers in parentheses next to county names represent the total number of cities and townships in the county included in the analysis.
Data are private sector only. Source: DEED, Quarterly Census of Employment and Wages (QCEW) |
||||||
With 12, Dakota County had the largest number of cities and townships with employment gains through the recession, including two (Eureka Township and Mendota) of the top three with the largest percentage growth. In all, two out of every five cities in Dakota County experienced job gains between 2007 and 2009.
What is striking about many of the communities listed in Table 2 is their population size. Only five cities - Andover, Golden Valley, Mounds View, Mendota Heights, and Waconia - had a population estimate of 10,000 or more in 2012. More than half (56.3 percent) of the cities had resident populations of less than 5,000.
Furthermore, of the 48 cities with no 2007-2009 job losses, 12 had no job loss in 2010, 2011, or 2012, as seen in Table 3. Essentially these cities suffered no job losses at a time when the regional economy had a net employment decline of 31,074 jobs between 2007 and 2012. And of those cities, only one - Rosemount - had a resident population of more than 20,000. Rosemount also had the largest annual private employment at 5,070 in 2012. Except for Columbus with 1,149 jobs all the other cities had fewer than 1,000 private sector jobs in 2012 on an annual average basis.
| Cities With No Job Losses Between 2007 and 2012 | ||||
|---|---|---|---|---|
| City (County) | Population | 2007 Employment | 2012 Employment | 2007-2012 Percent Growth in Employment |
| Columbus (Anoka County) | 3,929 | 782 | 1,149 | 46.9% |
| Deephaven (Hennepin County) | 3,690 | 427 | 572 | 34.0% |
| Falcon Heights (Ramsey County) | 5,426 | 755 | 897 | 18.8% |
| Hilltop (Anoka County) | 842 | 192 | 278 | 44.8% |
| Lake St. Croix Beach (Washington County) | 1,057 | 38 | 59 | 55.3% |
| Lilydale (Dakota County) | 774 | 320 | 395 | 23.4% |
| Mendota (Dakota County) | 206 | 115 | 311 | 170.4% |
| Miesville (Dakota County) | 127 | 115 | 122 | 6.1% |
| Randolph Township (Dakota County) | 663 | 90 | 142 | 57.8% |
| Rosemount (Dakota County) | 22,384 | 4,524 | 5,070 | 12.1% |
| Waterford Township (Dakota County) | 501 | 637 | 697 | 9.4% |
| Willernie (Washington County) | 506 | 148 | 237 | 60.1% |
| Source: DEED, Quarterly Census of Employment and Wages (QCEW) | ||||
Several other cities and townships deserve mention, including seven cities that suffered relatively small employment declines in 2010, but which rebounded with job growth in 2011 and 2012 to exceed their 2007 employment levels. These are: Chanhassen, Dahlgren Township, Mahtomedi, Sand Creek Township, St. Anthony, Waconia, and Watertown Township.
Seven cities and townships weathered the recession and continued to add jobs in 2010 and 2011: Belle Plaine, Coates, Golden Valley, Jackson Township, Lexington, Oak Grove, and Oak Park Heights. Despite job losses in 2012, these cities had more jobs in 2012 than they did in 2007.
Six cities and townships with job increases during 2007-2009 saw annual employment declines in each subsequent year extending to 2012: Eureka Township, Forest Lake, Hamburg, Hassan Township, South St. Paul, and Young America Township. Eureka Township, and Hassan Township had strong enough job growth during 2007-2009 that it wasn't eroded by losses in 2010, 2011, and 2012. Forest Lake had small annual job losses in the three years following the recession to end 2012 with an average annual employment level higher than their 2007 level. South St. Paul, on the other hand, was still 1,012 jobs below their 2007 employment level in 2012.
The remaining 16 cities and townships that weathered the recession with no employment losses faced a mix of gains and losses in 2010, 2011, and 2012.2 2012 employment in eight cities is at pre-recessionary levels; four have job counts below their 2007 levels. Thirty-nine of the 48 cities (or 81.3 percent) with no job losses during 2007-2009 had, by 2012, recovered to their 2007 employment levels.
While some cities and townships were little affected by the recession, 121 of them struggled. Only 33 cities and townships had 2012 annual average employment levels at or above their 2007 levels. So, contrary to the cities that suffered no jobs during the 2007-2009 time frame, for those that experienced job loss during the recession, only 27.3 percent have rebounded.
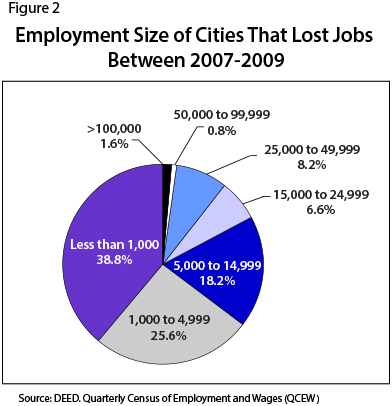
Figure 2 shows the 2007 employment size of cities that lost jobs between 2007-2009. Cities with less than 5,000 jobs accounted for 51.2 percent of all cities included in the analysis and 64.4 percent of cities with an employment base of less than 5,000 jobs experienced declining employment during the recession. For these cities, the loss of mid- to large-sized employer through a business closing could drastically impact local employment levels.

Table 4 lists the top 10 cities and townships with the highest percentage loss in annual employment between 2007 and 2009 and the cities with the smallest percentage loss. With the exception of Shakopee, with a private employment level of 15,647 jobs in 2007, all these cities had employment levels below 5,000. In fact, nearly all of the cities with the largest percentage loss of jobs between 2007 and 2009 had employment levels less than 1,000.3
| Cities with the Highest and Lowest Job Losses Between 2007-2009 | |||||
|---|---|---|---|---|---|
| Highest Job Loss, 2007-2009 | Lowest Job Loss, 2007-2009 | ||||
| City (County) | Numeric Decline | Percent Decline | City (County) | Numeric Decline | Percent Decline |
| Ravenna Township (Dakota County) | 129 | -77.2% | Shakopee (Scott County) | 164 | -1.0% |
| Baytown Township (Washington County) | 122 | -69.7% | Northfield (Dakota County) | 88 | -1.1% |
| Helena Township (Scott County) | 286 | -69.6% | New Prague (Scott County) | 39 | -1.6% |
| Lauderdale (Ramsey County) | 1,172 | -62.6% | St. Paul Park (Washington County) | 26 | -2.0% |
| May Township (Washington County) | 65 | -50.8% | White Bear Lake (Ramsey County) | 49 | -2.1% |
| Loretto (Hennepin County) | 269 | -44.3% | Grant (Washington County) | 10 | -2.2% |
| Hampton (Dakota County) | 58 | -41.7% | Champlin (Hennepin County) | 79 | -2.2% |
| Louisville Township (Scott County) | 174 | -41.0% | Ramsey (Anoka County) | 121 | -2.5% |
| Spring Park (Hennepin County) | 356 | -40.5% | Castle Rock Township (Dakota County) | 10 | -2.7% |
| Hollywood Township (Carver County) | 42 | -36.8% | Marine on St. Croix (Washington County) | 3 | -2.9% |
| Source: DEED, Quarterly Census of Employment and Wages (QCEW) | |||||
Of the cities with the highest job losses, only one - Hollywood Township - had an employment level in 2012 that exceeded its 2007 measure. On the other hand, the recovery was evenly split for cities that had the smallest job losses between 2007 and 2009. Grant, Northfield, Ramsey, Shakopee, and St. Paul Park had recovered to their 2007 job level in 2012.
For the 33 cities that rebounded to their 2007 employment levels in 2012, the majority did not experience further job losses in 2010, 2011, or 2012. Eight cities that had continued job decline in 2010 saw their employment increase in 2011 and 2012. The impact of the recession after 2009 was minimally felt in Blaine, Grant, Lakeland, Northfield, Marshan Township, Medina, Ramsey, and Rockford.
| Cities with Recessionary Job Loss (2007-2009) and Annual Gains Since (2010-2012) | |||||||
|---|---|---|---|---|---|---|---|
| 2012 Employment Above 2007 Level | 2012 Employment Below 2007 Level | ||||||
| City (County) | Population | 2012 Employment | Number of Jobs Above 2007 Level | City (County) | Population | 2012 Employment | Number of Jobs Below 2007 Level |
| Minneapolis (Hennepin County) | 392,008 | 253,930 | 4,938 | Circle Pines (Anoka County) | 5,018 | 733 | -284 |
| Edina (Hennepin County) | 48,829 | 49,132 | 2,308 | Ham Lake (Anoka County) | 15,462 | 2,948 | -277 |
| Brooklyn Park (Hennepin County) | 77,446 | 24,207 | 1,532 | Anoka (Anoka County) | 8,723 | 8,597 | -126 |
| Hopkins (Hennepin County) | 17,939 | 11,940 | 1,150 | Louisville Township (Scott County) | 1,284 | 329 | -95 |
| Eagan (Dakota County) | 64,972 | 49,481 | 958 | West Lakeland Township (Washington County) | 4,091 | 236 | -28 |
| Oakdale (Washington County) | 27,699 | 8,474 | 883 | Laketown Township (Carver County) | 2,220 | 113 | -23 |
| Lakeville (Dakota County) | 57,048 | 12,885 | 862 | - | - | - | - |
| Maple Grove (Hennepin County) | 63,928 | 28,971 | 858 | - | - | - | - |
| Maplewood (Ramsey County) | 39,065 | 26,801 | 626 | - | - | - | - |
| Rogers (Hennepin County) | 11,508 | 7,163 | 238 | - | - | - | - |
| Little Canada (Ramsey County) | 9,987 | 6,318 | 232 | - | - | - | - |
| Hugo (Washington County) | 13,739 | 2,173 | 229 | - | - | - | - |
| Prior Lake (Scott County) | 23,385 | 3,036 | 91 | - | - | - | - |
| Carver (Carver County) | 4,012 | 256 | 76 | - | - | - | - |
| St. Paul Park (Washington County) | 5,322 | 1,333 | 54 | - | - | - | - |
| Woodbury (Washington County) | 64,238 | 18,814 | 44 | - | - | - | - |
| Tonka Bay (Hennepin County) | 1,499 | 358 | 33 | - | - | - | - |
| Hollywood Township (Carver County) | 1,042 | 136 | 22 | - | - | - | - |
| Afton (Washington County) | 2,912 | 404 | 3 | - | - | - | - |
| Source: DEED, Quarterly Census of Employment and Wages (QCEW) | |||||||
However, the majority of cities and townships with 2007-2009 employment declines have not recovered. Among the 87 cities4. that had not regained their 2007 employment levels in 2012, it was very common to see one or more years of employment growth during 2010 to 2012 in these cities. Job growth may have been up in one year but down the next. Only 12 experienced annual average employment declines in all the years following the recession. The 12 cities and townships that had annual average job losses in each year between 2007 and 2012 are: Arden Hills, Bayport, Brooklyn Center, Champlin, Denmark Township, Douglas Township, Fort Snelling, Hastings, Lauderdale, New Market Township, New Prague, and Norwood Young America. For these cities recessionary job losses were only the start of a trend that has continued three years after the recession's end.
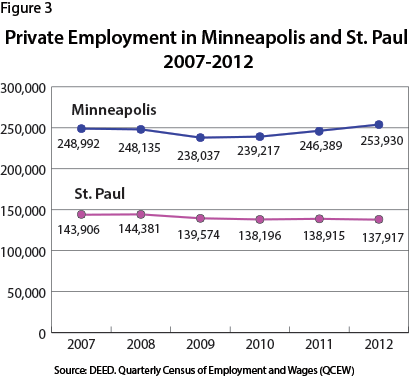
The central cities of Minneapolis and St. Paul deserve their own attention, as their recessionary and post-recessionary trends have deviated. Both cities witnessed job loss between 2007 and 2009. Minneapolis lost a larger number of jobs (10,955) at a larger share (4.4 percent) of private sector employment than St. Paul, which lost 4,332 jobs, or 3.0 percent.
Figure 3 illustrates annual employment in both central cities between 2007 and 2012. While employment in St. Paul continued to decline in 2010, increased slightly in 2011, and declined again in 2012, employment in Minneapolis increased each year thereafter.

The difference in employment trends among the region's central cities cannot be explained by the composition of industrial employment. The composition of private industry employment in Minneapolis and St. Paul is similar. In fact, Health Care and Social Assistance have the highest concentration of employment in both cities, 27.5 percent and 19.4 percent, in St. Paul and Minneapolis, respectively. Professional and Technical Services (12. 8 percent) and Finance and Insurance (10.7 percent) round out the three largest employment sectors in Minneapolis, while Finance and Insurance (8.6 percent) and Administrative and Support Services (8.4 percent) round out St. Paul's top three.
One key difference not studied here is the impact of government workers on private employment. Federal, state, and local government employment accounts for 14.4 percent of total employment in Minneapolis and 20.6 percent of total jobs in St. Paul. As public sector jobs declined in the years immediately following the recession, this loss of jobs may likely have impacted private employment, particularly in downtown St. Paul with its concentration of state government workers.
First, it's very clear that whether or not a city or township had job losses during the recession - and, perhaps, the extent of those job losses - really contributes to whether they are fully recovered. Of the 48 communities that gained employment 2007 to 2009, 41 of them (85.4 percent) are fully recovered. Of the 121 communities that lost employment during the recession, 87 of those (71.9 percent) are not recovered.
To see if a common theme emerges among cities that successfully regained recessionary job loss, we could look in more detail at the industrial mix of select cities. One interesting trend emerges in three of the 12 cities that experienced no job loss between 2007 and 2012: Consistent over-the-year growth in the city's dominant industry. One in three jobs in Deephaven are in the Educational and Health Services sector, which grew each year, starting with an average of 112 jobs in 2007 and ending with 219 jobs in 2012, a near doubling of employment in the sector. Nearly half of all private sector jobs in Falcon Heights are in the Leisure and Hospitality sector, which grew by 48.6 percent over the five-year time period. Finally, Rosemount's leading sector - Manufacturing - experienced small over-the-year job declines in 2009, but rebounded for gains in subsequent years.
The strongest employment growth between 2007 and 2012 in Oakdale was in non-dominant sectors. Financial Activities, which accounted for less than five percent of jobs in the city, grew by 172.5 percent over five years. In Eagan four out of seven industry super-sectors actually had job losses between 2007 and 2012. It was from strength in the Educational and Health Services (1,782 jobs) and Financial Activities sectors (1,508 job gain) that the city ended 2012 with a net job gain over 2007. In short, there may not be one reason why one city did better than another.
Of course, recovery doesn't mean all industry sectors are at their 2007 employment levels. Manufacturing employment in 2012 is 8.9 percent higher than 2007 in Brooklyn Park, but in Edina the number of Manufacturing jobs declined by a third over five years. Redistribution of industry employment may also be possible, along with changes to the types of jobs available and the wages those jobs offer.
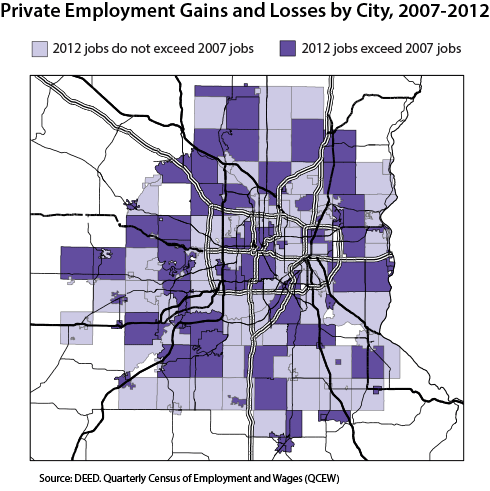
The location of the city or township might matter to its post-recessionary job growth (Map 1). A map of the cities and townships that saw overall growth between 2007 and 2012 appears to be geographically scattered. While there are probably quality of life factors that come into play, for the geographically distant suburbs it looks like highway accessibility is a significant factor. The inter-connection of cities, commuting patterns, and post-recessionary job recovery could lend itself to an entirely separate analysis.

Finally, the prevalence of jobs in a city or township doesn't always translate to the labor market outcomes of its residents. This analysis did not compare unemployment rates of counties or large cities to their employment changes, so we don't know if the residents of cities or townships that recovered their 2007 employment levels in 2012 are better off or not. The reason why these don't translate is not everyone works in the city or county in which they reside. And the skills sets of residents may not match the needs of employers in the resident's home city. That type of analysis is beyond the scope of the Quarterly Census of Employment and Wages (QCEW) data. However, the degree to which neighboring cities and counties within the region return to or exceed pre-recessionary employment levels signal more opportunities for job seekers and people in career transition.
Thanks to Brent Pearson and Amanda Rohrer for assistance on this article.
1Of the 193 cities and townships identified, 185 had population estimates in 2012. By necessity any comparisons of employment trends by population size will use this set of cities and townships.
2The 11 cities and townships which have recovered to 2007 employment levels are: Andover, Dayton, Gem Lake, Independence, Mendota Heights, Mounds View, North Oaks, Orono, Shorewood, St. Francis, and Vermillion. The five cities and townships where 2012 employment levels fall short of their 2007 levels are Credit River Township, Elko New Market, Greenvale Township, Robbinsdale, and Victoria.
3Lauderdale had an average of 1,872 private sector jobs in 2007.
42012 employment figures were not available for Randolph, so it is excluded from this analysis.