
by Mustapha Hammida
December 2022
This article answers two main questions. First, how did the distribution of hourly wages of Minnesota workers change over the last five years? Second, how is the recent burst in inflation influencing growth in the average hourly wages of workers and along the whole wage distribution? Constructing and comparing the statistical distributions of hourly wages of workers before, during and after the Pandemic Recession allows us to analyze how COVID and its aftermath affected the wage distribution and its properties.
This article is the second of a three-article series which illuminates our understanding of the effects of COVID-19 on the distribution of hourly wages of Minnesota workers. The first article in this series Minnesota Wage Distribution Analysis - Article One: Distribution of Hourly Wages of Workers Before COVID-19 introduces the hourly wage distribution of Minnesota workers in second quarter 2019. The next article, forthcoming in the next issue of this publication, will address how changes in the composition of employment affect the measure of aggregate average hourly wage growth in general and during the Pandemic Recession.
The article has two main sections, one for each of the questions posed above. The first section discusses how the statistical distribution of hourly wages of Minnesota workers changed between second quarters 2017 and 2022 covering three years before Pandemic Recession, the year of the Pandemic Recession, and two years after the Pandemic Recession. Specifically, it discusses changes in the shape of the distribution, patterns of hourly wage growth across sections of the distribution, wage inequality, and the growth in the average hourly wages. The second section presents estimates of growth in real hourly wages of workers using alternative measures of inflation.
The Pandemic Recession removed a record 283,000 workers from the Minnesota pool of employment between February and May 2020, according to the Local Area Unemployment Statistics. As is common in recessionary times, these separations did not impact all types of workers equally, with differences by industry, occupation, gender, age, education, skill level, etc. and thus caused shifts in the hourly wage distribution of workers.
The analysis of the effect of the Pandemic Recession on hourly wages focuses on changes over time in the distribution as well as its statistics. To curb the effects of seasonality common in the analysis of time series data, we limit the analysis to the year-over-year changes in the second quarter of 2017 to 2022. In addition, the wage distributions presented in this section are in nominal terms, which express wages in current dollars (not adjusted for inflation).
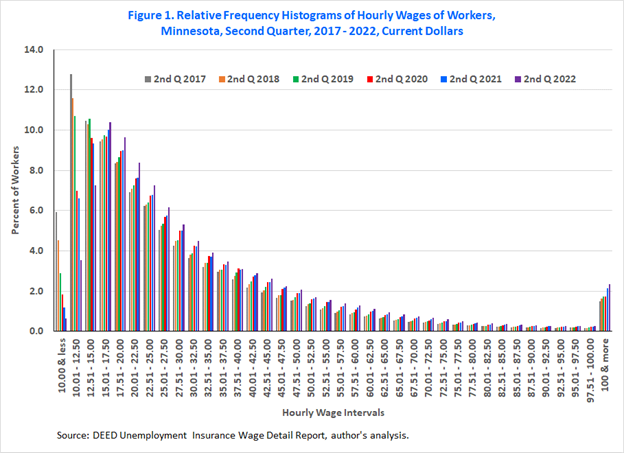
To describe the distributions over time we use the empirical probability distribution function (EPDF), or a relative frequency histogram displayed in Figure 1 and the empirical cumulative distribution function (ECDF) displayed in Figure 2. (See first article referenced above for details on the EPDF and ECDF of the wage distribution.)
Figures 1 and 2 establish that, over the last six years, the properties of the hourly wage distribution of workers highlighted in the first article, including lack of symmetry and right-skewedness, are unchanging.
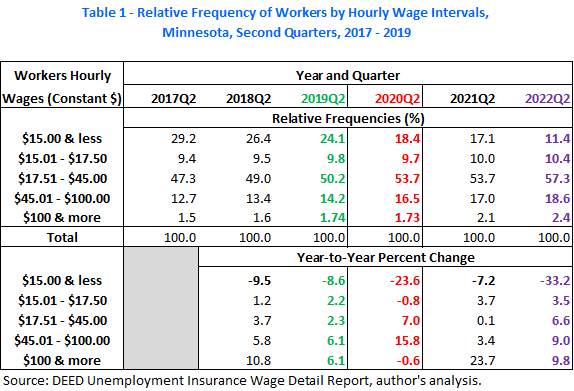
However, although the general shape of these distributions is fixed, there is a clear shift in the distribution of hourly wages of workers. Specifically, the section of low hourly wages is shrinking and the rest of distribution is expanding at different speeds (Figure 1). To bring this shift into clear focus, we isolate the sections of the distribution where comparable movements and speeds are occurring. Table 1 identifies five sections: one section with declining shares and four sections with rising shares at increasing rates1.
In second quarter 2017, workers making $15.00 or less accounted for 29.2% of workers. In the next two years this rate declined by 9.5% and then by 8.6% to settle at 24.1% in second quarter 2019 (Table 1). The five percentage points (difference between 29.2 and 24.1) lost from the low-wage section of the distribution forms the overall gain in the rest of the distribution. Specifically, the section of the distribution containing workers earning between $17.51 and $45.00 gained 2.9 percentage points (from 47.3% to 50.2%) between second quarters of 2017 and 2019. Furthermore, a gain of 1.5 percentage points (from 12.7% to 14.2%) went to the section of the distribution containing workers earning between $45.51 and $100.00.
As the Pandemic Recession hit in second quarter 2020, the distribution of hourly wages of workers continued its shift to the right but at faster rates than in the previous two years. The trimming rate in the section of workers making $15.00 or less reached 23.6%, reducing the share of this section to 18.4%. In other words, this section of the distribution lost 5.7 percentage points, which is larger than the combined reductions over the previous two years. In addition, during the Pandemic Recession, the share of workers in the section ($15.01 to $17.50)2 next to the shrinking section of the distribution dipped a bit (a tenth of a percentage point, from 9.8% to 9.7%).
The other section that experienced a cut was, surprisingly, the one for workers making $100 or more per hour. Its share declined by a mere one hundredth of a percentage point (from 1.74% to 1.73%). This decline may be due partly to retirement decisions by older, highly paid workers around health and safety concerns or their inability to telework.
Of course, the loss of 5.8 (5.7 + 0.1) percentage points from the left side of the distribution of hourly wages of workers results in a gain in other sections of the distribution. In fact, the section of workers earning between $17.51 and $45.00 grabbed 3.5 percentage points (from 50.2% to 53.7%) and the section of workers earning between $45.01 and $100.00 grabbed the remaining 2.3 percentage points (from 14.2% to 16.5%). The expansions in each of these two sections of the distribution were larger than their respective combined gains between second quarters 2017 and 2019.
One year after the end of the Pandemic Recession, the wage distribution was still shifting, though at a slower rate than anytime during the period studied except for the highest paid workers who make $100 or more. Then, by second quarter 2022, the shift in the hourly wage distribution accelerated. The section of the distribution wherein workers make $15.00 or less contracted by a third from a year ago to 11.4%, the lowest level in the last five years. In absolute terms, this contraction translates into a loss of 5.7 percentage points, the same size as during the Pandemic Recession. However, unlike in second quarter 2020, all other sections of the hourly wage distribution saw increases in their shares.
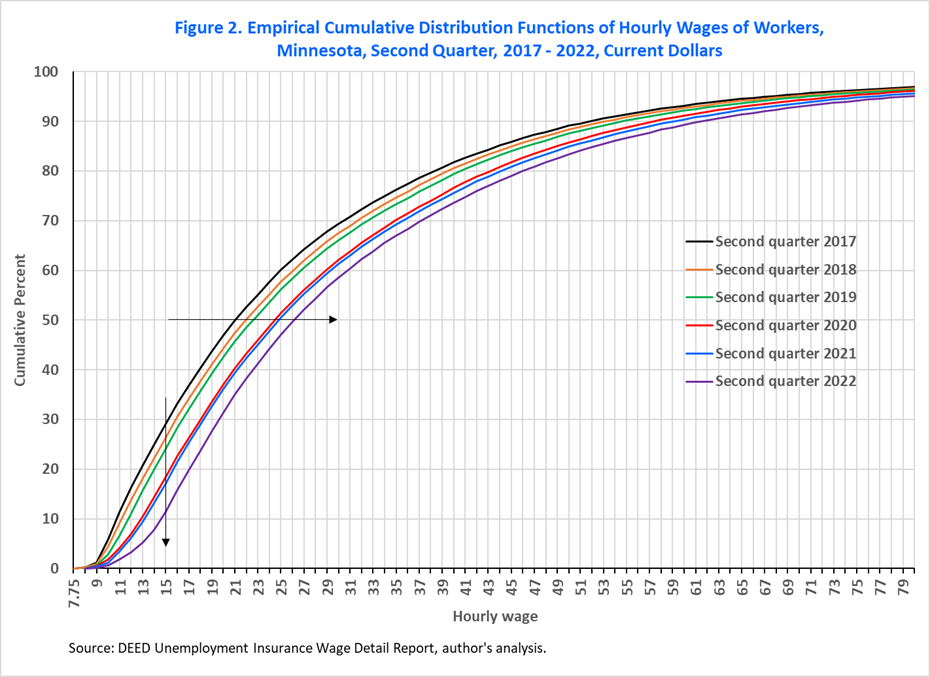
The shifts in the wage distribution over time are also clearly visible in Figure 2. To preserve the sharpness of the ECDFs, Figure 2 graphs only the bottom 95% of the support of the hourly wage distributions. A visual comparison of the horizontal or vertical distances between the ECDFs reveals that the hourly wage distribution changed slowly between second quarters 2017 and 2019, rapidly in second quarter 2020, more slowly in second quarter 2021, then rapidly again in second quarter 2022.
In addition, Figure 2 shows that the hourly wages of workers, as measured by percentiles (and not by wage mobility of individual workers through the wage distribution)3, have been increasing consistently across the entire distribution of hourly wages in each of the second quarters of the last five years. Visually, at any point along the vertical axis, a movement from left to right indicates that the selected cumulative p-percent is associated with increasing levels of corresponding p-percentiles on the horizontal axis (see for example the horizontal line arrow at the 50% in Figure 2). At the 50% point on the vertical axis, the corresponding median hourly wage increased continually every year from $21.05 in second quarter 2017 to $24.50 in second quarter 2020 and to $26.14 in second quarter 2022.
Conversely, at any hourly wage on the horizontal axis, a movement from top to bottom from above the curves towards this selected hourly wage, marks declining p-percent of workers earning the selected hourly wage (see for example the vertical line arrow pointing towards $15.00 on the horizontal axis). The hourly wage level of $15.00 was the 29th percentile in second quarter of 2017 but only the 11th percentile in second quarter of 2022. In other words, while 29% of workers were making $15.00 or less in second quarter 2017, only 11% of workers were making those wages in second quarter 2022.
While determining the factors driving these shifts in the hourly wage distribution is outside the scope of this study, we posit a few possible explanations. One explanation may be the spillover effect of the yearly increase in the state minimum wage that started in 2018 and thereafter in the cities of Minneapolis and St. Paul, all to ensure fair wages for the low-paid workers. These increases appear to be effective in raising the wages of workers found in the farthest left side of the hourly wage distribution. Another explanation, related to the previous one, considers the spillover effects from voluntary employer minimum wages. As some large employers announce increases in their hiring wage floors, such as $15.00, other employers follow suit leading to higher wages for low-paid workers relative to high-paid workers.
A third explanation has foundation in the general health of the Minnesota labor market, in particular during the two periods 2017 to 2019 and 2020 to 2022. These four years around the year of the Pandemic Recession brought Minnesota a tight labor market and record low unemployment rates, ultimately dipping to an all-time low of 1.8% in June 2022. In such a hot labor market, employers increase wages to attract new workers to job openings and to hold on to their workforce. Certainly, these factors and others, such as shifts in the supply and demand for low skilled relative to high skilled workers, are acting jointly to give rise to the hourly wage distributions shown in Figures 1 and 2.
Although Figure 2 shows that hourly wages of workers are improving over the entire distribution, it conceals differences in the growth of hourly wages of workers across different sections of the distribution. To see exactly how the hourly wage of workers are increasing across the wage distribution Figure 3 plots the year-over-year growth rates in hourly wages in each decile, or one-tenth, of the distributions.
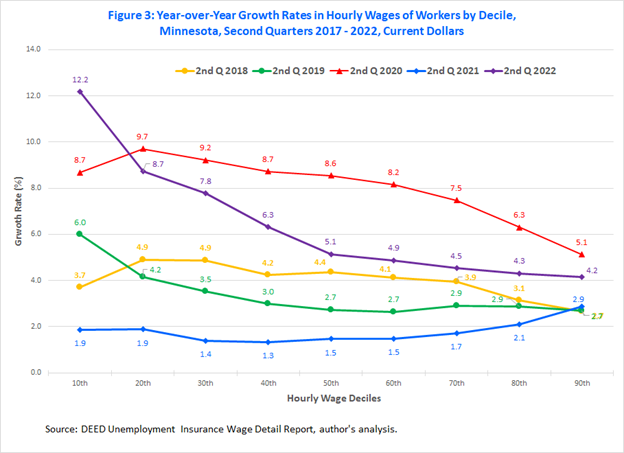
Figure 3 unveils three results. First, nominal hourly wages of workers have been increasing in all deciles of the distribution in each of the last five years. In addition, the bottom half of the distribution enjoyed faster growth relative to the top half. In fact, comparing the hourly wage deciles between second quarters of 2017 and 2022 show that the aggregate growth in hourly wages was monotonically decreasing from the lowest to the highest deciles. The bottom three deciles each grew by at least 30% over the five years period, or on average by at least 6% annually. The highest cumulative growth rate was in the first decile with 36.5% (from $10.80 to $14.74), or 7.3% on an annualized basis. In contrast, the cumulative growth rates in hourly wages in the middle and top deciles (or median and 90th) were 24.2% (from $21.05 to $26.14) and 18.8% ($51.75 to $61.48), respectively. In other words, the median hourly wage was growing by 4.8% and the top decile hourly wage by 3.8% annually.
Second, at least in the short run, there is a high level of dynamism in the distribution of hourly wages leading to no clear, single trend in the growth of hourly wages across the distribution. Upon careful inspection of Figure 3, growth in hourly wages of workers followed four different patterns in five years. The first pattern involves growth at increasing rates in the first two deciles followed by growth at decreasing rates in the remaining deciles. This pattern occurred in the second quarter of 2018 and was amplified in the second quarter of 2020 during the Pandemic Recession. For example, in the second quarter of 2018, the hourly wages of workers in the second decile grew by 4.9% while the hourly wages of workers in the eighth decile grew by 3.1%. But by second quarter 2020, these deciles grew by 9.7% and 6.3%, respectively.
The second pattern, exhibited in the second quarter of 2019, shows hourly wage growth at decreasing rates in the bottom half of the distribution, then stable growth in the top half of the distribution. While workers in the first decile saw a growth rate of 6.0%, workers in the top half of the distribution saw a growth rate fluctuating between 2.7 and 2.9%.
The distribution of hourly wages in each of the two years after the Pandemic Recession exhibited still different patterns. The third pattern, present in the second quarter of 2021, produces hourly wage growth at declining rates up to the fourth decile and growth at increasing rates thereafter. Hourly wages of workers in the first two deciles grew by 1.9% while those between the fourth and ninth deciles underwent faster growth from a low of 1.3% to as fast as 2.9%.
The last pattern, present in the second quarter of 2022, which resembles the one with aggregate growth over the whole period, shows hourly wage growth at decreasing rates from the lowest to the highest deciles. Workers in the first decile enjoyed a 12.2% growth rate, compared to 5.1% and 4.2% for workers in the middle decile and top decile, respectively.
Finally, the third result from Figure 3 indicates that during the Pandemic Recession the hourly wages of workers in all deciles grew at phenomenal speeds compared to the two years prior. Except for the first decile that grew from 6.0% in second quarter 2019 to 8.7% in second quarter 2020 (an increase of roughly 50%), the growth rates in the rest of the deciles of the distribution were double or triple their levels of a year ago. These large jumps in the growth rates of hourly wage deciles are partially the effect of the changes in the pool of employment caused by COVID-19. As most of the workers who lost employment came from industries and occupations concentrated in the bottom half of the distribution, the wage distribution shifted to the right, and the hourly wage deciles increase accordingly. Thus, as COVID-19 changed the composition of employment it accelerated wage growth across the distribution. More on this composition effect in the forthcoming article.
In the two years after the Pandemic Recession, the economy still could not shake off the effects of COVID-19. In second quarter 2021, the composition effect was still vigorously in play but in the opposite direction. As some workers returned to their jobs, the shift in the wage distribution slowed significantly leading to smaller wage growth. In fact, excluding the top decile, the growth rates in hourly wages deciles in the second quarter of 2021 were the smallest in the last five years.
However, in the second quarter of 2022, workers in all deciles experienced their highest growth rates in hourly wages in the last five second quarters excluding the quarter of the Pandemic Recession. In addition to the inherent, regular changes in the composition of the workforce, the red-hot Minnesota labor market as well as the continuing pressure of inflation that followed the Pandemic Recession, may have sparked these impressive growth rates.
Differing growth rates in percentiles of hourly wages of workers have a direct effect on wage inequality, or on how the dispersion of wages is altered. When the differences in growth rates are significant enough, faster growth rates in the top half of the distribution relative to the lower half increases wage inequality, while faster growth rates in the bottom half of the distribution relative to the top half reduces wage inequality. Similar to the analysis of wage inequality in second quarter 2019 done in the first article referenced above, to assess how wage inequality has changed over the last five years we examine specific percentile ratios as well as the shares in total wage earnings of different types of workers. The choice of these measures of inequality stems from the fact that they are easy to compute and highly intuitive.
Table 2 gives the bottom decile (10th), the quartiles (25th, 50th, and 75th), the top decile (90th) of hourly wages and standard wage inequality statistics formed by ratios between these percentiles. Because all percentile ratios in Table 2 have the higher percentile in the numerator of the ratio, they all have values greater than one. As a result, for a particular percentile ratio and a reference value, values that are getting smaller than the reference value indicate shrinking spread, or falling wage inequality, while values getting larger than the reference value indicate expanding spread, or rising wage inequality. In other words, falling wage inequality describes a situation where wages of workers at the lower percentile are inching closer toward wages of workers at the higher percentile, while rising wage inequality describes a situation where wages of workers at the higher percentile are pulling away from wages of workers at the lower percentile. Most of the annual changes in percentile ratios in Table 2 point to a general pattern of declining wage inequality, except for a few instances highlighted in Table 2.
Starting at the middle half of the distribution, wage inequality has been decreasing over the last five years, though ever so slightly. The ratios 50th/25th and 75th/50th evaluate the spread of hourly wages in the middle half of the distribution. The 50th/25th ratio has declined from 1.50 in second quarter 2017 to 1.47 in second quarter 2020, then to 1.43 in second quarter 2022. Put differently, a worker at the median point was making $1.50 for every dollar made by a worker at the 25th percentile in second quarter of 2017. Then by second quarter 2022, this ratio shrank slightly reaching $1.43 to $1.00. In relative terms, the ratio 50th/25th improved by 5% over five years. Although this indicates an annual average of one percent, the two significant annual reductions occurred during the Pandemic Recession in 2020 (1.1%, from values of 1.49 to 1.47) and in 2022 (2.5%, from 1.46 to 1.43).
Over the section between the median and the 75th percentile, the spread of hourly wages improved slightly too. The 75th/50th ratio varied between 1.62 in second quarter of 2017 to 1.58 in second quarter 2022. In other words, the difference in relative pay between a worker at the 75th percentile and a worker at the median improved from $1.62 to a dollar to reach $1.58 to a dollar, a reduction of 2.4% in the 75th/50th ratio over five years. Looking along the annual reductions, the most significant reduction happened during the Pandemic Recession where the 75th/50th ratio shrank by 1.7%, from 1.61 to 1.58.
Even small changes in the percentile ratios, such as from 1.62 to 1.58, are indicative of noticeable changes in actual hourly wages. For example, in second quarter 2017, the 50th hourly wage was $21.05 and the 75th was $34.01, and if we assume that the median hourly wage was the only one that changed by second quarter 2022, then it must reach $21.57 to yield the value of 1.58 for the 75th/50th ratio. Actually, the 50th and the 75th both increased to $26.14 and $41.21, respectively.
Analyzing wage inequality across the median, the values of the ratios 50th/25th and 75th/50th indicate that the hourly wages of workers within the interquartile range (between the 25th and 75th) are spread almost evenly. Between 2017 and 2022, the annual average for the ratio 50th/25th was 1.47 and the annual average for ratio 75th/50th was 1.60.
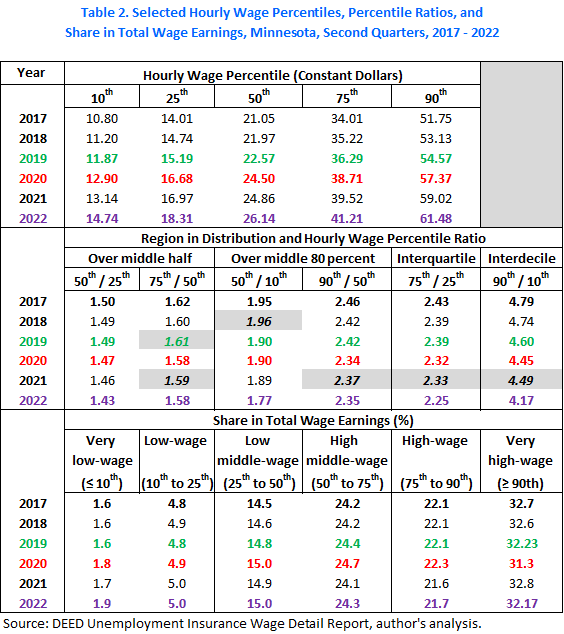
Expanding the middle region from half to four-fifths, we focus on the ratios 50th/10th and 90th/50th. Over this region and given that the values of the 90th/50th ratio are significantly larger than those of the 50th/10th ratio, hourly wages of workers in the top half of the region are more dispersed than those in the bottom half of the region. For example, in second quarter 2022, the ratio 90th/50th was 2.35 compared to 1.77 for 50th/10th. These values saw near consistent annual improvements since second quarter 2017 (from 2.45 and 1.95, respectively) and indicate a moderate reduction in wage inequality over the middle 80% of the distribution. However, the narrowness in the spread of hourly wages (or reduction in hourly wage inequality) is faster on the left side of the median than on the right side. In fact, over the last five years the 50th/10th ratio declined by 9.0% while the ratio 90th/50th contracted only by 4.3%.
In addition, each of the ratios 50th/10th and 90th/50th seems to follow a different declining pattern. The ratio 50th/10th declined slowly up to second quarter 2019 (from 1.96 to 1.90), held constant during the Pandemic Recession, and then picked up speed thereafter (from 1.90 to 1.77). Over the last five years, the fastest annual reduction in wage spread occurred in second quarter 2022 (6.3%, from value of 1.89 to 1.77).
On the other hand, the ratio 90th/50th declined at different speeds through second quarter 2020 (from 2.46 to 2.34), increased in second quarter 2021, and then erased some of that jump and settling at 2.35 in second quarter 2022. Unlike the ratio 50th/10th, the fastest annual reduction in the ratio 90th/50th occurred during the Pandemic Recession (3.2%, from value of 2.42 to 2.34).
Regardless of the pattern of change in these ratios, the general movements in the spread of hourly wages in the middle 80% of the distribution are such that the 10th percentile is moving faster towards the 50th percentile and the 50th percentile, itself, is moving towards the 90th percentile (which is also moving) but at a slower pace.
A related measure to the ratios 50th/25th and 75th/50th is the ratio 75th/25th, also called the interquartile ratio5, that compares the hourly wages of workers in the top quartile (including the top decile) to those of workers in the bottom quartile (including the bottom decile). In second quarter 2017, the ratio 75th/25th was 2.43. This means that a worker at the 75th percentile hourly wage was making $2.43 to every dollar of hourly wage of a worker at the 25th percentile.
A year later, the ratio improved to 2.39 (or by 1.6%) and held stable for another year. Then, its decline accelerated to 2.32 (or by 2.9%) during the Pandemic Recession and once more in second quarter 2022 reaching a value of 2.25 (or by 3.4%). Thus, by second quarter 2022 the gap in hourly wages between workers at the 75th percentile and workers at the 25th percentile contracted to $2.25: $1. This amounts to a significant reduction of 7.3% over the last five years.
Like the ratio 75th/25th, the ratio 90th/10th, also called the interdecile, is related to the ratios 50th/10th and 90th/50th in a similar fashion. The 90th/10th compares the hourly wages between the top decile (or very high-wage) workers relative to the bottom decile (or very low-wage) workers. As expected, among all the percentile ratios given in Table 2, the ratio 90th/10th assumes the largest values. For example, in the second quarter of 2017, the hourly wages of very high-wage workers were 4.79 times greater than those of very low-wage workers.
Furthermore, of all the percentile ratios in Table 2, the 90th/10th was the only one that consistently and significantly diminished in the two years before the Pandemic Recession. In the second quarter of 2019, it contracted to 4.60, or by 4.1% from two years ago. Then during the Pandemic Recession, as with all other percentile ratios in Table 2, the 90th/10th declined but at the fastest rate (3.3%, down to 4.45). This feature repeated itself again in the second quarter of 2022. The hourly wages of very high-wage workers were only 4.17 times greater than those of very low-wage workers. In relative terms, this was a reduction of 7.1%, the largest annual decline of all percentile ratios in Table 2 during the last five years.
Thus, while wage inequality was decreasing even prior to the Pandemic Recession, the decrease in wage inequality picked up speed during the Pandemic Recession, and further accelerated in the second quarter of 2022. In addition, while wage inequality is decreasing across the distribution, it is occurring faster at the lower half than at the higher half.
The changes in the percentile ratios give one perspective on the change in wage inequality. The other perspective is from the analysis of shares in total wage earnings. These shares give another measure of wage inequality, which captures the concentration of wage earnings. The lower part of Table 2 gives these shares by workers type (as defined in the first article) over the period second quarter 2017 to 2022.
Recall that total wage earnings is the product of hourly wages and hours worked. Consequently, movements in both hourly wages and in hours worked drive changes in shares of total wage earnings. It appears, however, that changes in hourly wages have played a major role in the changes of shares of total wage earnings.
Before the Pandemic Recession, the share of wages earned by very high-wage workers declined by 1.5% from 32.7% in the second quarter of 2017 to 32.2% in the second quarter of 2019. Then during the Pandemic Recession, it further decreased by 2.9% (the fastest decline in the 5-years period) to 31.3%, the lowest level over the period. However, in the two years since the recession, changes in this share were mixed. In the first year, the share rose to 32.8% regaining all previous losses plus some. However, as of second quarter 2022, the share declined by 1.8%, back to the level of 2019, 32.2%.
Similarly, the share of wages earned by workers in the top 25% (or high-wage and very high-wage workers) of the distribution followed an identical pattern between the second quarters of 2017 and 2022. It started at 54.9% and reached its lowest level of 53.7% during the Pandemic Recession, but finished at 53.9% in the second quarter of 2022, losing one percentage point over five years.
The reductions in the shares of wages earned by workers at the upper end of the distribution are gains in the shares of the other four categories of workers. During the pre-COVID-19 years, in absolute terms, most of the increase in shares occurred for the middle-wage workers (between the 25th and 75th percentiles). The share of middle-wage workers jumped from 38.7% to 39.2%, growth of 1.2%. However, the shares of very low-wage and low-wage workers increased from 6.4 to only 6.5%, growth of 0.7%.
Then, during the Pandemic Recession, the share of wages earned by the lowest 25% of workers grew faster by 3.6% to a share of 6.7%, while the middle 50% of workers grew only by 1.2% to a share of 39.6%. Among all four worker categories, the very low-wage workers saw the fastest growth of 8.3%, from a share of 1.6 to 1.8%.
The next two years after the Pandemic Recession brought mixed changes to the shares of wages earned by workers below the 75th percentile. Generally, the shares of each of these worker types lost some ground in the second quarter of 2021, but a year later they all regained some, or all, of their losses. Moreover, their shares were higher in second quarter 2022 than in the same quarter of 2017. Impressively, the very low-wage workers recorded the fastest growth in share of wages earned of 17.7%, from 1.6% to 1.9%. Overall, the collective share of workers below the 75th percentile increased by 2.2%, from 45.1% to 46.1%; gaining the one percentage point lost by the high-wage workers.
So far, our discussion centered on percentile statistics of the distribution. Another important statistic is the mean hourly wage of the distribution or the average hourly wage for a worker. In our UIWDR-based hourly wage distributions, the mean is higher than survey-based statistics due to the inclusion of very high hourly wages common in the top section of the distribution. As such, the mean is susceptible to changes in either the hourly wages or the composition of highly paid workers. Table 3 provides the mean and its growth between second quarters 2017 to 2022, as well as the median for comparative purposes.
Indeed, Table 3 shows that the mean was growing slower than the median over the period, except in second quarter 2021. Thus, between second quarters 2017 and 2022, the ratio of the median-to-mean improved from 72.7% to 74.1%. In other words, the median grew faster (24.2%) than the mean (21.8%) in the last five years, another indication that wage inequality has been shrinking. The mean growing slower than the median implicitly indicates that hourly wages in the top section of the distribution are not pulling away from the middle of the distribution faster than growth in the bottom half of the distribution.
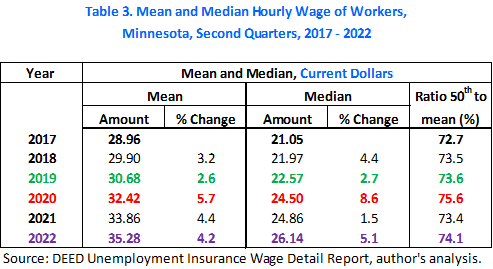
The average hourly wage of workers was $28.96 in second quarter 2017. In the two years before COVID-19, the average hourly wage grew at an annual average of 2.9%, reaching $30.68 in second quarter 2019. As COVID-19 battered jobs in second quarter 2020, the average hourly wage of workers appreciated the fastest in that five-year period, posting growth of 5.7%. As mentioned earlier as regards the shift in the distribution, this high growth rate is partially driven by the COVID 19-induced changes in the composition of employment.
In second quarter 2020, the average hourly wage of workers stood at $32.42. During the two years of recovery that followed, the average hourly wage continued to grow, though at a slower pace than during the Pandemic Recession, but at a faster pace than during the two years prior to the Pandemic Recession. Specifically, the average hourly wage of workers grew by 4.4% and 4.2% in second quarters 2021 and 2022, respectively. These impressive rates are probably the result of the combined effects of continued changes in the composition of the workforce and the increased tightness in Minnesota's labor market.
Our analysis so far has been limited to hourly wages expressed in current dollars, or not adjusted for inflation. However, the post Pandemic Recession recovery is being blemished by increasingly large climbs in prices fueled by supply-chains disruptions, shifts in consumer demand from services to goods, strong consumer demand overall, and increases in energy costs. In such an environment of stubbornly rising inflation, it is important to evaluate how real hourly wages are faring. Real hourly wages are nominal hourly wages adjusted for inflation and provide an estimation of workers' actual purchasing power.
To adjust for inflation, two price indices are commonly used. The first one is the Consumer Price Index (CPI) from the U.S. Bureau of Labor Statistics while the second one is the Personal Consumption Expenditures Price Index (PCEPI) from the U.S. Bureau of Economic Analysis. Although both indices use the same principle that requires a basket of consumption goods to estimate changes in prices, they have differences. One major difference is in their scopes. The CPI covers only urban consumers and their out-of-pocket expenditures on goods and services. The PCE considers both urban and rural consumers, and includes all expenditures purchased on their behalf. While each one has merits, uses, and users, the CPI usually reports more inflation than the PCEPI. As a result, using the CPI as a deflator may underestimate real hourly wages growth and overestimate real hourly wages decline, in particular if the CPI overestimates inflation significantly.
Table 4 gives total (or headline as opposed to core) inflation rates for the 12 months ending in May using the PCEPI and the Consumer Price Index for Urban Workers (CPI-U). From May 2018 to 2021, while the difference in measures of inflation between the two indices shifted around, it stayed within a half of a percentage point. However, the measures for May 2022 diverged substantially; the CPI-U estimates a rate of 8.7%6 compared to 6.5% from the PCEPI. This large difference in the measure of inflation had significant impact on the growth rate of real hourly wages in 2022.
To assess how the growth in the average hourly wage of workers compares to inflation, we express the second quarter nominal hourly wages in 2017 dollars. For comparison purposes, Table 4 provides real average hourly wage and its growth using both the PCEPI and CPI-U.
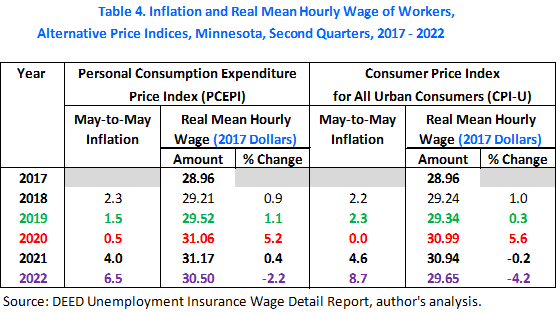
According to the PCEPI and as inflation was contained through the Pandemic Recession, the average real hourly wage enjoyed some growth of about 1% before the recession, followed by a significant growth of 5.2% during the recession. However, as inflation broke away from the Federal Reserve target of around 2% after the end of the Pandemic Recession the growth in the average real hourly wage slowed significantly. Notably in second quarter 2021, the growth in prices (4%) was almost equal to the growth in nominal hourly wages (4.4%).
By second quarter 2022, as inflation sped up to 6.5% and nominal hourly wages slowed a bit down to 4.2%, growth in real hourly wages turned negative wiping out about half of its gains achieved during the Pandemic Recession. As a result, it is down to $30.50, which is nonetheless still higher than its level of $28.96 in second quarter 2017. In relative terms, real hourly wages grew by 5.3% over the last five years period.
Using the CPI-U, the impact of inflation on hourly wages is more severe than with the PCEPI. Growth in real hourly wages has been negative for both years of the post-COVID recovery. In addition, the decline is deeper, shaving an additional 0.6 percentage points in 2021 and 2 percentage points in 2022. Subsequently, calculating the growth of real hourly wages based on CPI instead of PCEPI results in only 2.4% growth over the past five years.
Comparatively, the overall growth in real hourly wages between 2017 and 2022 of 5.3% obtained with the PCEPI is more than twice as fast as the one obtained with the CPI-U7. However, regardless of which price index is used to adjust for inflation, growth rate in nominal hourly wages in the post Pandemic Recession years is greatly diminished by inflation.
Changes in average real hourly wages give general insight on how nominal hourly wages are keeping up with price increases. However, they say little about what is happening across the hourly wage distribution. We adjusted the nominal hourly wage deciles using both price indices. Figure 4 plots the year-over-year changes in PCEPI-based real hourly wage deciles8.
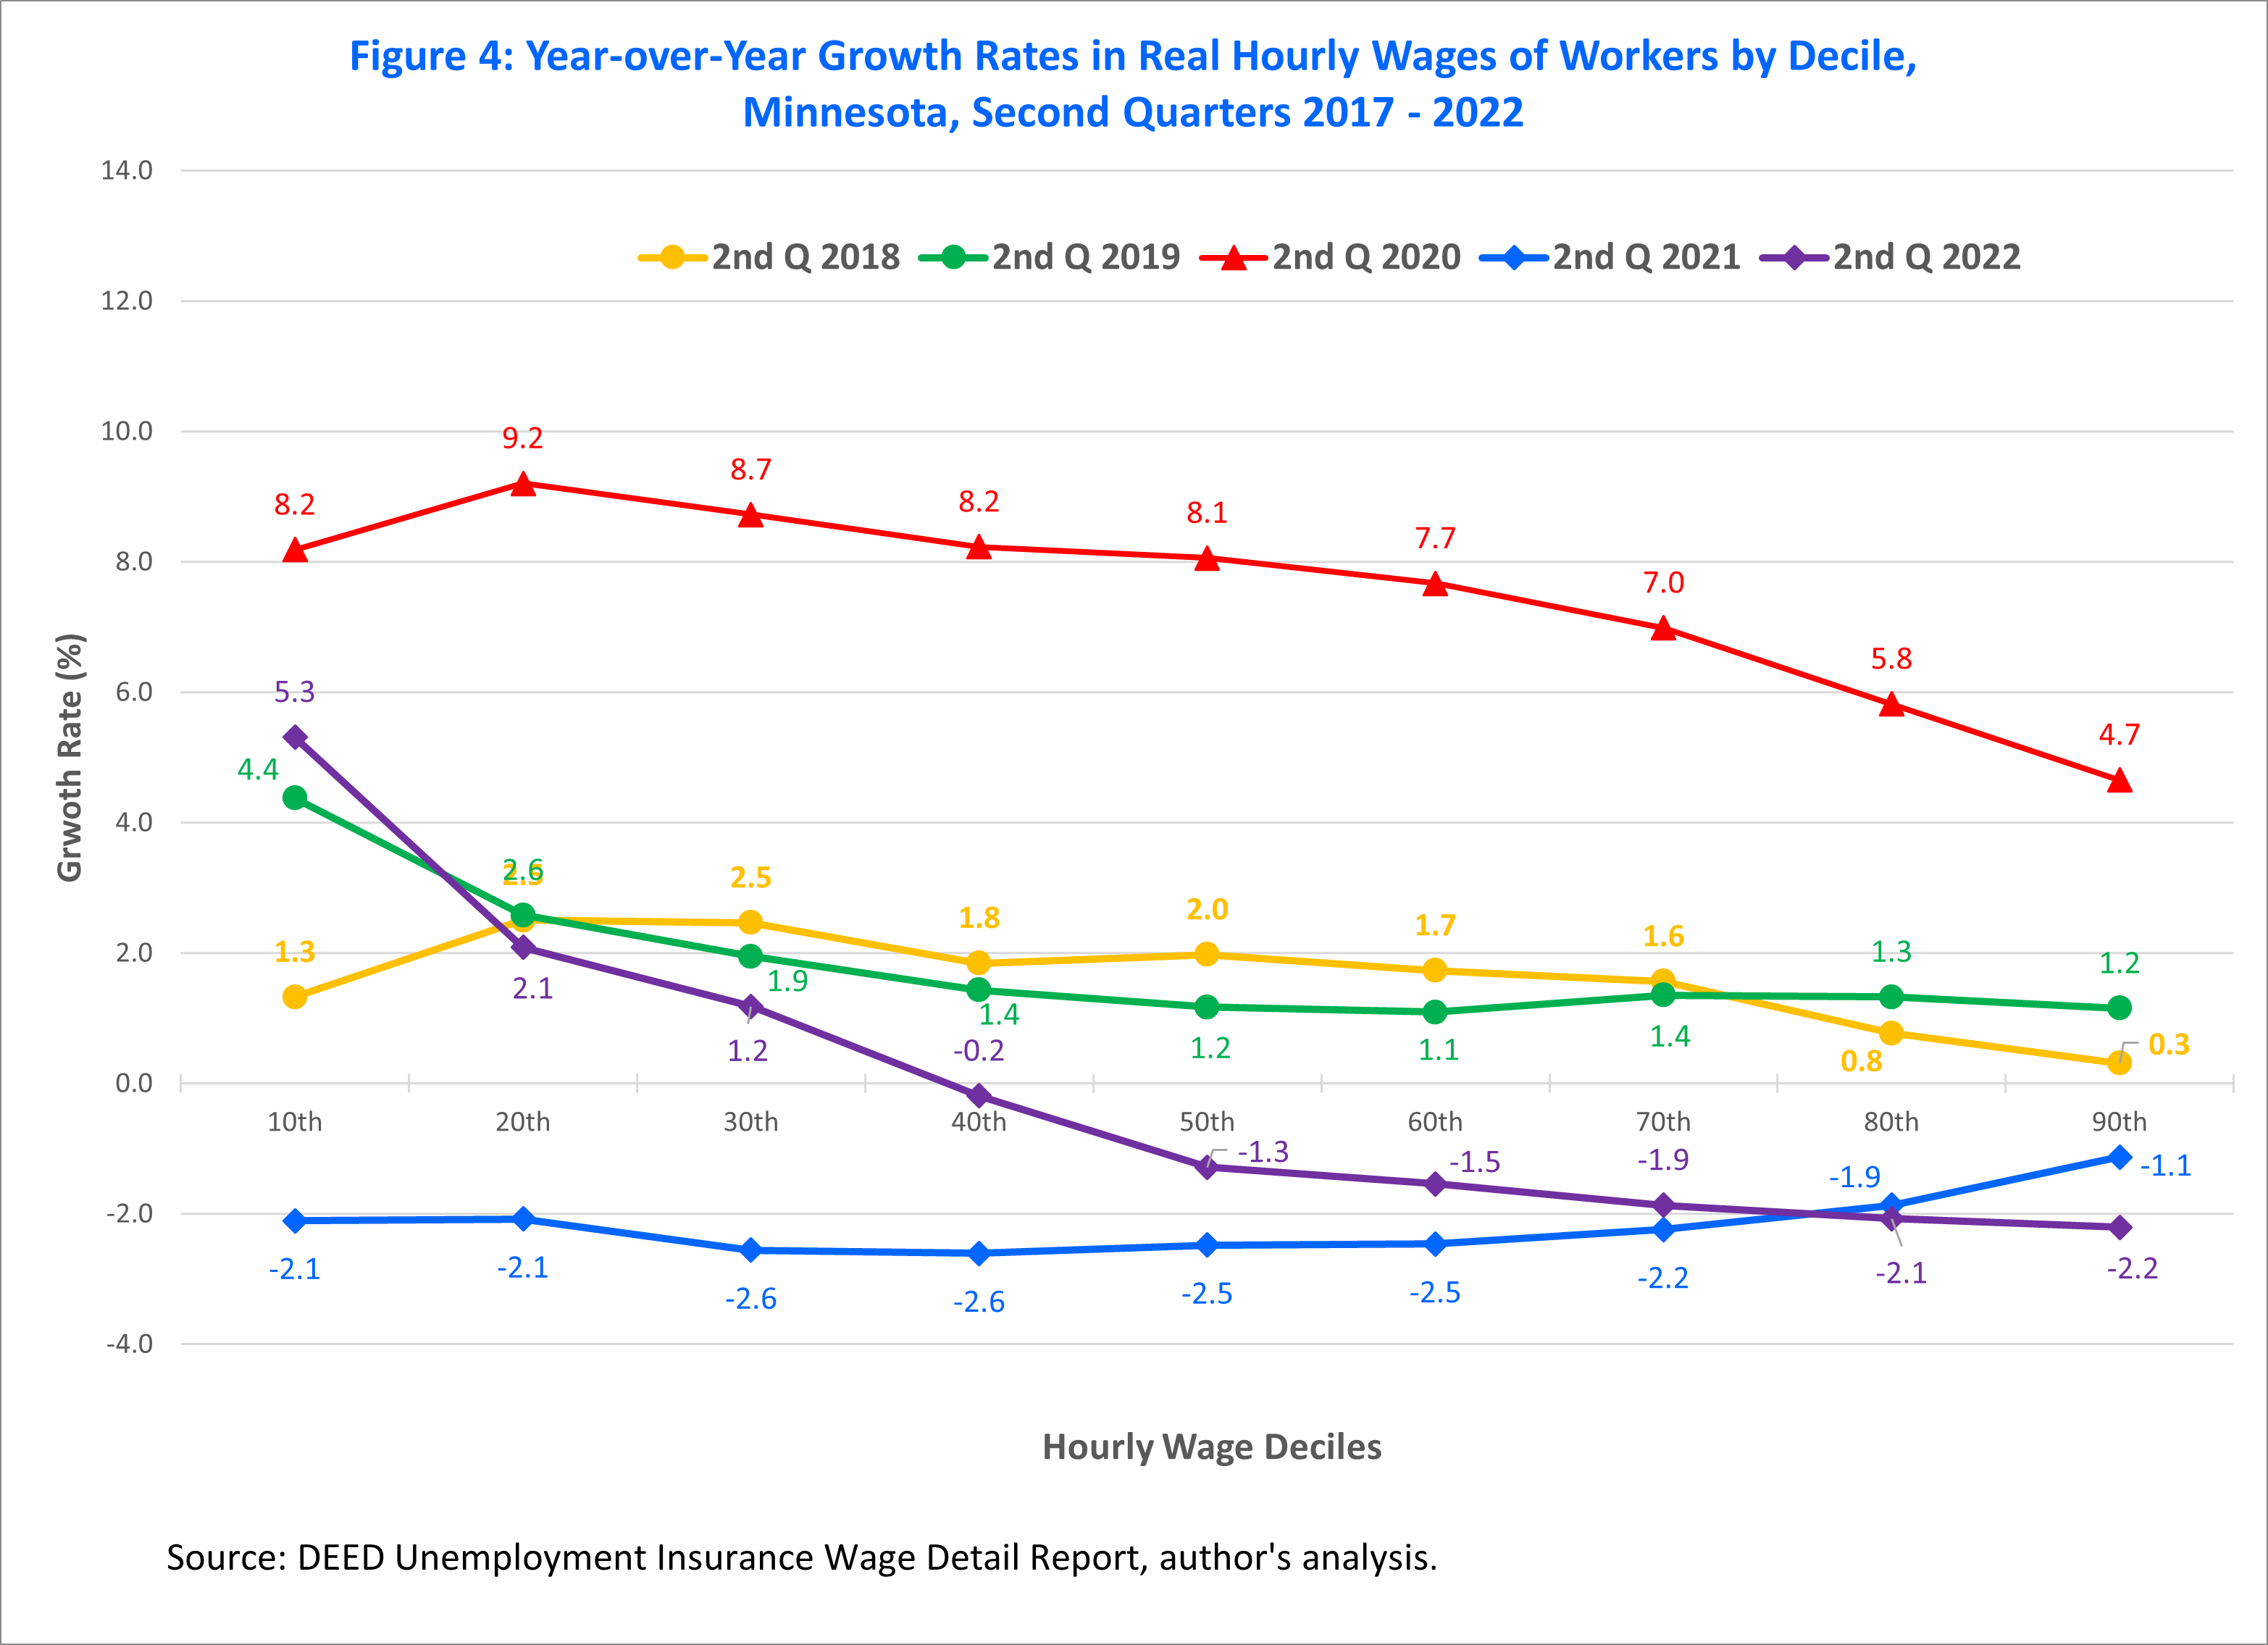
Since real hourly wage deciles for a particular year are derived from their respective nominal hourly wage deciles by adjusting them by that year's inflation measure, the curves in Figure 4 are closely related to their equivalents in Figure 3. More precisely, the shape of each curve for the real hourly wage deciles is the same between the two figures; however, its location is pushed down by the extent of the inflation measure. Thus, the patterns of growth in nominal hourly wage deciles discussed in Section I above hold true for real hourly wage deciles as well.
Apart from the constancy in patterns of growth in nominal and real hourly wage deciles, inflation has exerted different blows to the nominal hourly wage deciles. Over the last five years, gains in the nominal hourly wage deciles were mostly safe from inflation only during the Pandemic Recession period, which saw inflation of only 0.5%. This made the gains achieved during the Pandemic Recession in each decile of real hourly wages the largest over the period. In addition, each decile of real hourly wages grew faster than the average real hourly wage — a property emerging in the nominal figures as well.
Growth in all hourly wage deciles was observed again only in the two years prior to the Pandemic Recession. In these years, growth rates in nominal hourly wage deciles were all larger than growth in prices. Furthermore, just as experienced in second quarter 2020, growth rates in real (and nominal) hourly wage deciles in second quarter 2019 were larger than growth rate of the average real (and nominal) hourly wage.
As the growth in prices accelerated and surpassed all growth rates in nominal hourly wage deciles in second quarter 2021, all real hourly wage deciles lost ground. While inflation reached 4%, most nominal hourly wage deciles struggled to cross 2%, and none crossed the 3% mark. Consequently, the growth rates in real hourly wage of all deciles were in negative territory. But for the average real hourly wage, the situation was different; it grew by 0.4%. This means that unlike the previous two years, the growth rate of the average real (and nominal) hourly wage was larger than the growth rates in real (and nominal) hourly wage deciles.
By second quarter 2022, despite large growth in nominal hourly wage deciles, many hourly wage deciles have seen their growth stripped away by high inflation. Except for the bottom three deciles, all deciles posted negative growth in real hourly wages. Under normal, controlled levels of price growth, 5.1% growth in nominal median hourly wage would have been cause for celebration. However, facing 6.5% price growth, most of the high wage growth along the wage distribution was not enough to protect the purchasing power of hourly wages. However, as of October 2022, both measures of inflation are showing signs of easing. For example, the PCEPI was down to 6.0% after it reached 7.0% in June 2022.
During the two years of post-Pandemic Recession recovery, almost all real hourly wage deciles have lagged where they were during the Pandemic Recession. The only two deciles that did not decline between second quarter 2020 and second quarter 2022 are the bottom two deciles. Having said that, all real hourly wage deciles enjoyed growth over the period between the second quarters of 2017 and 2022 as a whole. This overall growth monotonically decreases as we move from the bottom decile to the top decile. For example, over the five-year period, the bottom decile grew by 18%, the median by 7.3%, and the top decile by 2.7%.
This article focused on the changes in the hourly wage distribution of Minnesota workers over a five-year period before, during and after the Pandemic Recession. Although the shape and properties of the hourly wage distribution were stable across this five-year period, the distribution shifted to the right. The section of low hourly wages shrunk while the rest of distribution expanded. The pace of the shift was fastest during the Pandemic Recession, and then again two years later in second quarter 2022. The differing pace and pattern of the shift meant that hourly wage percentiles were increasing at varying speeds. The fastest growth occurred in the bottom half of the distribution. This, in turn, translated into a significant decrease in wage inequality. While wage inequality decreased across the distribution, it occurred faster at the bottom half than at the top half.
Furthermore, growth in average hourly wages was significant during the Pandemic Recession, mostly fueled by the COVID-induced changes in the composition of employment. Moderate growth in average hourly wages continued in the post Pandemic Recession years, but this time propelled more by tightness in the labor market than by the regular composition effects. The gains in average hourly wage and across the wage distribution are being diminished by excessive increases in prices. How long it will be before inflation returns to its normal levels is anybody's guess, but the recent slowdown is sign of relief.
1The classification is based on the rate of change between the second quarter of 2019 and the second quarter of 2020 in each of the $2.50 bins. Most of the bins between $17.51 and $45.00 increased by 5 to 10% while most of the bins between $45.51 and $100.00 increased by 15 to 20%.
2The boundary of $17.50 marking the section where the share of workers declined is the result of choosing the width of bins equal to $2.50. Determining the exact cut-off of the negative COVID effect on the hourly wage distribution requires a finer breakdown of the support, or values of hourly wages, of the distribution.
3Note that changes in hourly wage percentiles between two points in time include both changes in hourly wages of workers who remain employed in both times as well as the changes in hourly wages that result from the net of movements of workers leaving and entering employment. For example, assume we hold all hourly wages constant and allow for a large proportion of workers from a particular section of the distribution to leave or enter, say the low wage section, will result in shifts of the wage distribution percentiles. Thus, references in the article to "changes in hourly wages of workers" are, loosely speaking, references to changes in percentiles.
4Changes in wage inequality are in reference to the measures of wage inequality in a specific time (such as, second quarter of 2017) and not to an optimal or fair level of wage inequality.
5The 75th/50th ratio is the product (and not the sum) of the ratios 50th/25th and 75th/50th. Similarly, the 90th/10th ratio is the product of 50th/10th and 90th/50th.
6The CPI-U used in Table 4 represents the estimate for Minneapolis and St. Paul, while the PCEPI is for the nation. The CPI-U for the US is also as divergent; it was 8.6. We compared the national CPI-U and the PCEPI from January 2000 to October 2022 and found that up to December 2021, (a) the difference CPI-U minus the PCEPI rarely exceeded one percentage point, (b) never exceeded 1.40 percentage points, and (c) the average of this difference is 0.3 percentage points. However, the monthly differences in 2022 were all higher than 1.40 percentage points, reaching 2 percentage points or higher for the months of May thru September. These large differences may partially be the result of the differences in expenditure weights in the formulas of the two indices. For example, housing receives a much higher weight in the CPI-U than in the PCEPI As a result, increasing prices of rent drive the CPI-U up faster than the PCEPI.
7Using the CPI-U for the US gives even a slower growth rate of 2.01% of hourly wages of workers between second quarters 2017 and 2022.
8The CPI-based real hourly wage deciles show the same patterns as exhibited in Figure 4, except for their locations in the figure. For example, the curves for second quarter 2021 and 2022 are pulled further downward by 0.6 percentage points and 2 percentage points, respectively, signifying deeper losses in real hourly wages.