by Derek Teed
October 2017
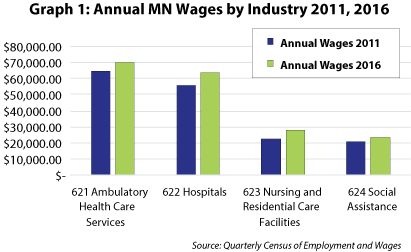
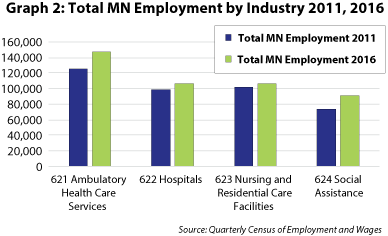
This industry is the 800 pound gorilla of the economy. Nobody wants to admit they need to use either half of it, but it's the economy's private employment growth engine at the moment, so somebody is using it since its employment is up 12.8% over the past five years in Minnesota. Nationally it represents 15.7% of the private employment, compared to five years ago when it represented 15.2%. Part of this increase in Minnesota comes from the wide range of services it covers: Offices of Physicians to Child Day Care Services with intermediate stops at Hospitals, Nursing Care Facilities, and a wide range of Social Assistance. Graph 1 shows the breakdown of wages by three digits of NAICS and Graph 2 the breakdown of employment:


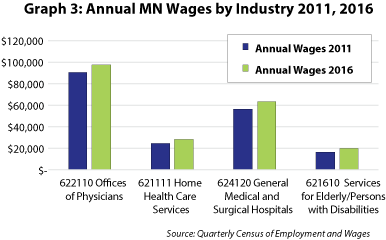
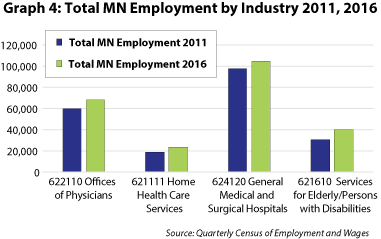
Some of the subsectors have higher employment that others and thus matter more to the economy. The top four six-digit codes and their employment and wage data for 2016 are shown in Graph 3:


While many of the occupations included in NAICS 62 involve considerable training and skills, the industry also has occupations that are available with on-the-job training. Education makes the difference. Table 1 shows a selection of wage data and education requirements at both ends of the spectrum:
| Occupation | Education | Median Wage |
|---|---|---|
| Surgeons | Professional Degree | $168,000 |
| Registered Nurses | Associates or Bachelor's | $75,400 |
| Social Workers | Bachelor's or Graduate | $54,121 |
| Personal Care Aides | High School or Less | $24,315 |
| Childcare Workers | High School or Less | $23,629 |
| Source: Occupational Employment Statistics | ||