by Dave Senf
January 2014
Note: All data except for Minnesota's PMI have been seasonally adjusted. See the feature article in the Minnesota Employment Review, May 2010, for more information on the Minnesota Index.
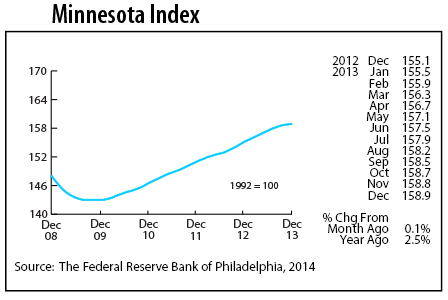
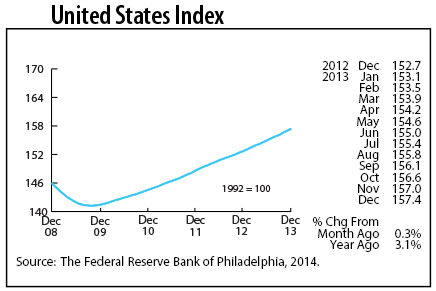
The Minnesota Index advanced for the 51st straight month in December, but the rate of growth has slowed over the last few months. The index advanced 0.1 percent for the third straight month in December after averaging 0.2 percent advancement during the summer. The U.S. index jumped 0.3 percent for the third straight month. Minnesota's index has trailed the U.S. index for the last four months. Minnesota employment increased in December along with average weekly manufacturing hours, but the state's unemployment rate remained unchanged, slowing the index.
Minnesota's index was 2.5 percent higher in December than a year ago, while the U.S. index was 3.1 percent higher than 12 months ago. The 2.5 percent increase was the lowest over-the-year increase since December 2010. The index will be revised when employment data is revised in March so the slowdown in the index may be revised away like last year. Most other indicators are not pointing toward a slowdown in Minnesota. The index was up 2.9 percent on an annual average basis in 2013.
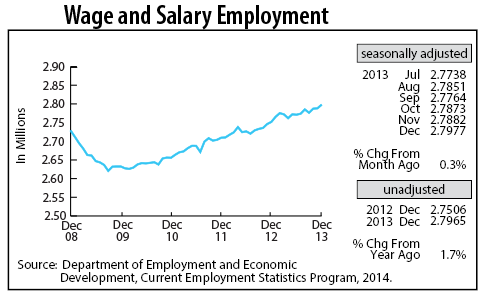
Minnesota's adjusted Wage and Salary Employment ended the year on a high note, increasing by 9,500 jobs. Private Sector and Public Sector payrolls climbed 6,900 and 2,600 respectively in December. Trade, Transportation, and Utilities led the private employers, adding 4,600 jobs. Hiring was also strong in Manufacturing, Educational and Health Services, and Professional and Business Services. Job cutbacks were the highest in Leisure and Hospitality, Other Services, and Financial Activities.
Over-the-year job growth in Minnesota using unadjusted employment jumped to 1.7 percent in December, a tad ahead of the national 1.6 rate. Minnesota's job growth for the year, on an annual average basis, was 1.8 percent. That's up significantly from 1.4 percent in 2012 and above the 1.6 percent achieved nationally in 2013. Minnesota's average annual job growth has averaged 2.0 percent since 1950. The 49,400 jobs added in 2013 on an annual average basis were the most since 2000.
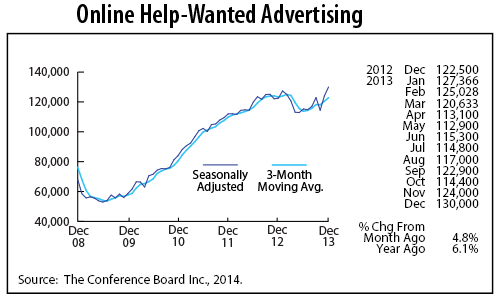
Minnesota's adjusted online Help-Wanted Ads climbed for the fourth time over the last five months, advancing 4.8 percent in December. The 130,000 ad volume was the highest since the series started in May 1995. The high volume suggests that Minnesota employers are ramping up hiring. Job growth should remain solid through the first few months of 2014 based on online help-wanted ads being a reliable proxy for labor demand.
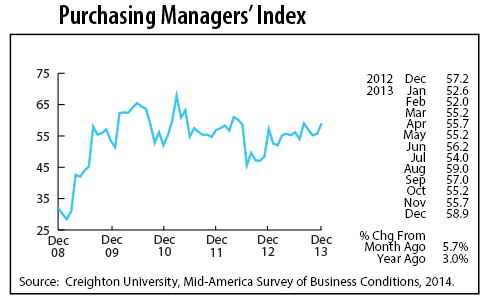
Minnesota's Purchasing Managers' Index (PMI) gained ground for the second straight month, jumping to 58.9, the highest reading since August. A reading above 50 indicates economic growth over the next few months, so December's solid reading implies that Minnesota's economy is on track to continue to expand during the first few months of 2014. The index averaged 55.4 for the year - the sixth highest annual reading since the index was first published in 1995.
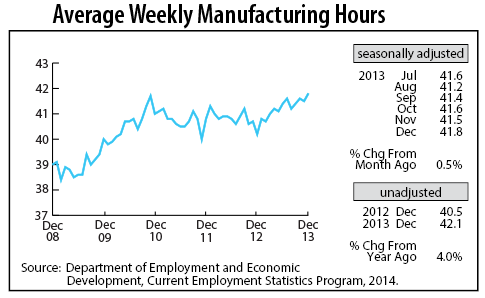
Adjusted Manufacturing Hours ticked up a couple of notches to 41.8 in December. This was the longest factory workweek since April 2007. The robust workweek is another indicator that Minnesota's economy remains on a steady growth path. Manufacturing should continue to add workers during the first half of 2014.
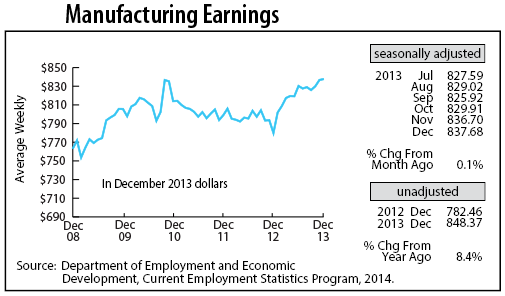
Manufacturing Earnings rose for the second month in a row, reaching a seven-year high of $837.68. Increases in manufacturing paychecks over the last few months have easily exceeded inflation, giving workers real gains in income over the last six months.
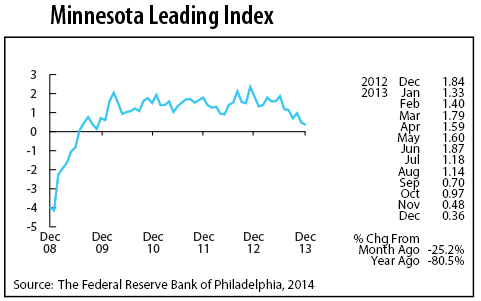
The Minnesota Leading Index waned for the fifth time in the last six months, falling to 0.36 in December. The index hasn't been this low since late 2009. The low reading implies that economic growth in the state is headed for a big drop-off during the first half of 2014. Such a prediction is inconsistent with all the other indicators. Look for the leading index to be revised upward when employment and income data is revised early in 2014.
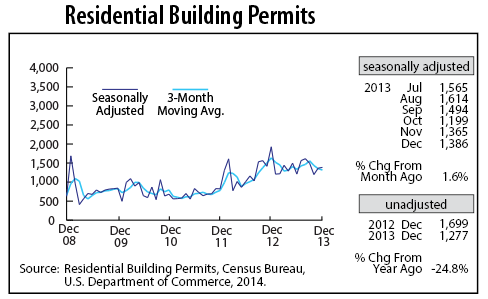
Adjusted Residential Building Permits inched up to 1,386 permits, just slightly above the average monthly volume for 2013. Minnesota's home-building rebound was uneven in 2013, but permits totaled 16,800 for the year. That is the highest annual total since 2007, but 52 percent below the 43-year average of 25,500.
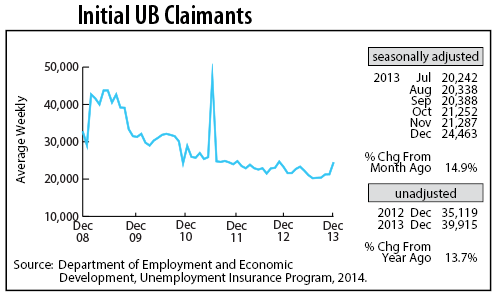
Adjusted Initial Claims for Unemployment Benefits (UB) surged in December, spiking 14.9 percent. Claim numbers were the highest since November 2012. The uptick was unexpected and perhaps tied to early winter weather. Total initial claims for 2013 were down 6.5 percent from 2012 and the lowest level since 2000.