by Mark Schultz
June 2015
Southeast Minnesota has surpassed its pre-recessionary employment levels and is still growing, although at a slower pace.
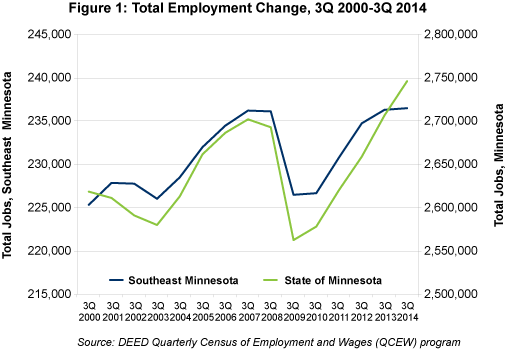
 Over the past decade and a half, Southeast Minnesota has experienced employment patterns similar to the rest of the state. From the third quarter of 2000 to the third quarter of 2014, the 11-county Southeast planning region and the state of Minnesota both saw job growth of 4.9 percent.
After sailing through the 2001 recession relatively unscathed, Southeast Minnesota and the state experienced nearly identical year-over-year employment gains from 2004 to 2007, with both growing 3.4 percent. Southeast, however, saw a slightly smaller decline than the state during the Great Recession from the third quarter of 2007 to the third quarter of 2009, losing just 4.1 percent of total employment compared with a 5.2 percent decline statewide.
Both the region and state have enjoyed a strong recovery since then, though Southeast Minnesota's job growth slowed in the past two years. Southeast Minnesota now has 12,112 businesses and 236,500 jobs, the highest number of third-quarter jobs ever reported in the region. The region and the state have not only recovered from the recession, both have surpassed their pre-recessionary employment levels (see Figure 1).

Although more than 9,700 jobs were lost during the recession in the Southeast region, some industries actually gained jobs and others declined only modestly.
Fifteen of the 20 main industrial sectors lost jobs from third quarter 2007 to third quarter 2009, with the largest cuts suffered in manufacturing (down 5,699 jobs), retail trade (down 1,894 jobs), construction (down 1,482 jobs), and administrative support and waste management services (down 1,147 jobs).
Southeast Minnesota showed its ability to bounce back, with 17 of the 20 sectors gaining jobs from third quarter 2009 to third quarter 2014, including the four industries listed above. Not surprisingly, manufacturing, retail trade and construction had the most net job losses during the recession and recovery. Likewise, half of the 20 sectors still have not regained all of the jobs that disappeared during the recession.
In contrast, administrative support and waste management services led the pack during the recovery, adding more than 2,750 new jobs in the past five years for a net gain of 1,576 jobs since 2007. Other industries that were also fully recovered include transportation and warehousing, information, and accommodation and food services.
Several other industries added jobs during the recovery and the recession, led by huge expansions in health care and social assistance. Already the largest-employing industry in the region by nearly 20,000 jobs, health care and social assistance gained more jobs from 2007 to 2009 than from 2009 to 2014, totaling 3,871 net new jobs during the entire period.
Educational services also enjoyed powerful growth during the recovery, gaining more than 1,050 jobs in the past five years. Agriculture, forestry, fishing and hunting; management of companies; and utilities also gained jobs throughout the recession and recovery (see Table 1).
| Southeast Minnesota Industry Employment Statistics | ||||||
|---|---|---|---|---|---|---|
| - | Number of Firms Q3 2014 | Number of Jobs Q3 2014 | Quarterly Payroll Q3 2014 | Recession | Recovery | Total |
| Change in Jobs Q3 2007 -Q3 2009 | Change in Jobs Q3 2009 -Q3 2014 | Change in Jobs Q3 2007 -Q3 2014 | ||||
| Total, All Industries | 12,112 | 236,500 | $2,680,289,212 | -9,705 | + 9,958 | +253 |
| Agriculture, Forestry, Fishing and Hunting | 370 | 3,060 | $22,081,816 | +202 | +453 | +655 |
| Mining | 17 | 170 | $2,186,633 | -23 | +15 | -8 |
| Construction | 1,459 | 9,464 | $119,883,212 | -1,482 | +207 | -1,275 |
| Manufacturing | 663 | 37,934 | $491,426,511 | -5,699 | +1,950 | -3,749 |
| Utilities | 51 | 1,530 | $37,299,387 | +77 | +55 | +132 |
| Wholesale Trade | 537 | 6,678 | $94,309,806 | -173 | +13 | -160 |
| Retail Trade | 1,804 | 26,967 | $158,804,559 | -1,894 | +365 | -1,529 |
| Transportation and Warehousing | 586 | 7,191 | $70,981,514 | -182 | +691 | +509 |
| Information | 184 | 3,667 | $42,206,869 | -134 | +394 | +260 |
| Finance and Insurance | 661 | 5,865 | $80,960,793 | -134 | -763 | -897 |
| Real Estate, Rental and Leasing* | 350 | 1,560 | $11,038,017 | -178 | -13 | -191 |
| Professional and Technical Services | 747 | 3,679 | $41,933,273 | -83 | +141 | +58 |
| Management of Companies | 55 | 2,937 | $70,172,154 | +28 | +422 | +450 |
| Administrative Support and Waste Management Services | 461 | 9,730 | $57,926,794 | -1,147 | +2,753 | +1,576 |
| Educational Services | 251 | 16,375 | $179,614,134 | +1 | +1,058 | +1,059 |
| Health Care and Social Assistance | 1,027 | 59,752 | $952,111,735 | +2,194 | +1,677 | +3,871 |
| Arts, Entertainment and Recreation* | 215 | 3,851 | $20,704,822 | -217 | -221 | -438 |
| Accommodation and Food Services* | 1,097 | 18,571 | $67,084,601 | -608 | +840 | +232 |
| Other Services* | 1,227 | 6,492 | $36,973,115 | -215 | +71 | -144 |
| Public Administration | 350 | 11,012 | $122,589,467 | -129 | +71 | -58 |
| Source: DEED's Quarterly Census of Employment and Wages (QCEW) | ||||||
| * Private Sector Data Only | ||||||
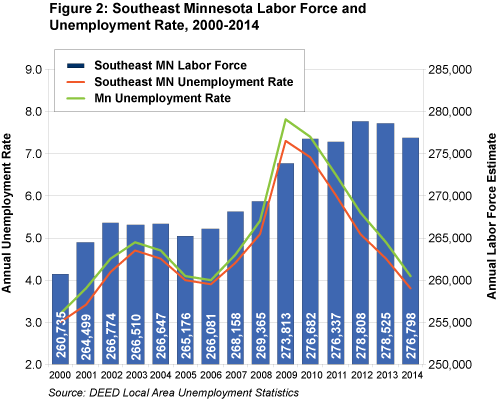
As the economy has recovered, unemployment rates in Southeast Minnesota have dropped significantly. The region's annual average unemployment rate retreated from a peak of 7.3 percent in 2009 to 3.8 percent for 2014, remaining about 0.5 percent below the statewide rate the entire time.
The rapid decline in unemployment is more impressive when considering the growth of the region's labor force over time. Southeast Minnesota now has over 16,000 more workers than it had in 2000, a steady 6.2 percent increase. The region had nearly 277,000 available workers in 2014, including about 10,500 who were unemployed and actively seeking work (see Figure 2).

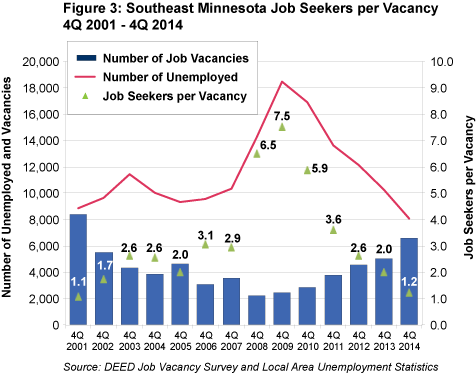
At the same time, hiring demand was increasing rapidly in Southeast Minnesota, with employers in the region reporting over 4,000 more job vacancies in fourth quarter 2014 than in 2009. In contrast, the number of unemployed workers in the region was cut nearly in half from its peak in 2009 to the current level in 2014, creating a very tight labor market.
With just 1.2 job seekers per vacancy in fourth quarter 2014, regional employers are dealing with the tightest labor market conditions since DEED started conducting the Job Vacancy Survey back in 2001. It is in direct contrast to the employment situation in 2009, when employers could choose from 7.5 unemployed workers for every job vacancy (see Figure 3).

While the employment and labor force growth is definitely a good sign for Southeast Minnesota, it does leave companies in a bit of a pickle. Many employers are finding it harder than ever to attract qualified candidates, and the competition between businesses is becoming more intense.
In order to recruit and retain high-quality candidates, companies may find themselves having to raise starting wages and emphasize other positive aspects of working at their company, such as fringe benefits like profit sharing, bonuses or an attractive workplace culture.
It appears that there has been a shift from potential employees trying to convince companies to hire them, to employers wrestling to convince job seekers why they offer the best place to work.
With all of this labor market activity going on, Southeast Minnesota finds itself in a position to continue to thrive. The growing labor force and strong recovery present the opportunity for a positive future in Southeast Minnesota.