by Dave Senf
April 2020
The Philadelphia Federal Reserve Bank, which produces the Minnesota Leading Index, has temporary suspended generation of state leading indices since the indices are based on data from the time period largely unaffected by the COVID-19 outbreak. The standard approach in estimating the leading indices may not be reliable given the sharp decline in several of the components used in modeling the leading indices.
All of the March indicators, except for initial claims, show only the leading edge of the unprecedented impact on Minnesota’s economy caused by the spread of COVID-19 and the resulting stay at home order. A more complete picture of COVID-19 impacts on Minnesota’s economy and labor market will be seen in April’s indicators.
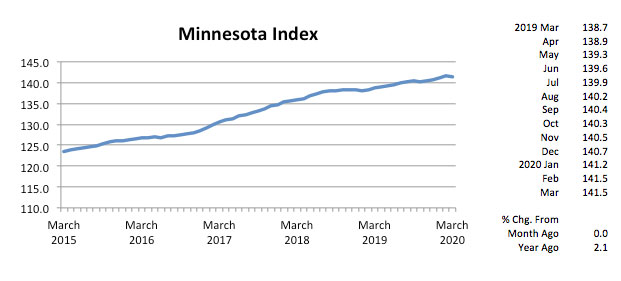
After recording solid advancement in the first two months of the year the Minnesota Index was flat in March, suggesting that Minnesota’s economy was just beginning to feel the fallout from the pandemic. March’s plateau reflected slipping wage and salary employment and a drop in average weekly manufacturing hours. The unemployment rate held steady at 3.1 percent in March but was based on a survey conducted during the second week of the month.
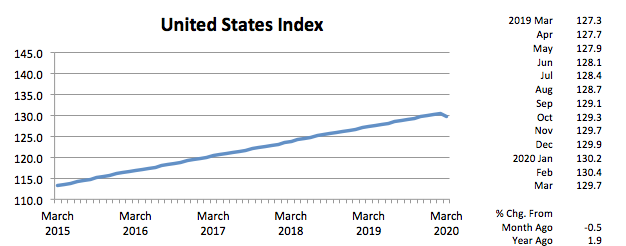
The U.S. index was down 0.5 percent in March, marking the start of the pandemic induced recession. The U.S. index was last negative in October 2009. Minnesota’s index was up 2.1 over the year while the U.S. index was 1.9 percent higher than a year ago.
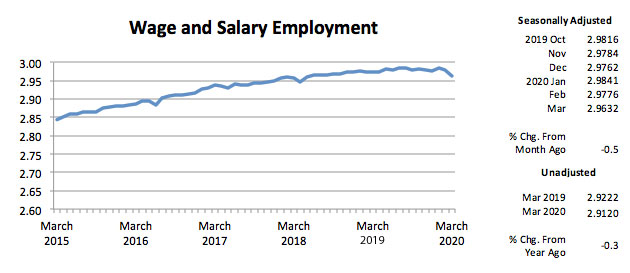
After reaching a record high in January, adjusted Wage and Salary Employment tailed off in February and March. March’s decline of 14,400 jobs was the largest job loss since July 2011 but will likely be revised downwards significantly and will still look modest compared to April’s plunge in jobs. The job decline was 0.5 percent in Minnesota and also nationwide.
Estimated wage and salary employment is, just like the unemployment rate, generated from a survey carried out during the second week of the month. The eye-popping rise in initial claims that resulted from the closure of restaurant and bars and schools in the middle of March followed by the stay at home order in the last week produced unprecedented job loss that will show up in April job numbers.
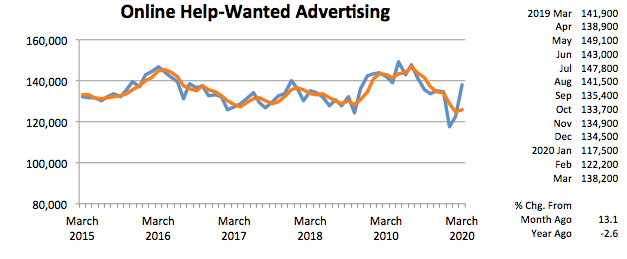
Online Help-Wanted Ads rose for the second month in a row in March, jumping to 138,200, which is close to the 140,700-monthly average for last year. Labor demand was apparently still strong in Minnesota at least early in the month. Online posting were up 13.1 percent in Minnesota and 8.3 percent across the nation in March.
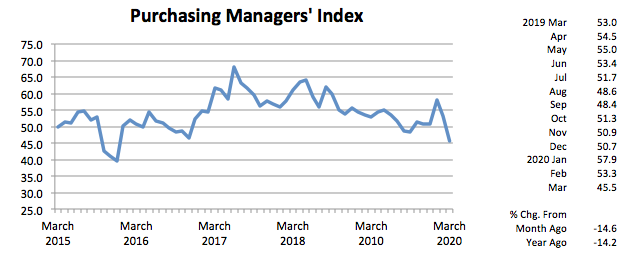
Minnesota’s Purchasing Managers’ Index (PMI) lost ground for the second month in a row in March, tumbling steeply to 45.5. That’s the lowest level since December 2015. April’s reading may challenge the all-time low of 28.4 recorded in February 2009. The Mid-America Business Index also dropped sharply to 46.7 while the national PMI tailed off to 49.1.
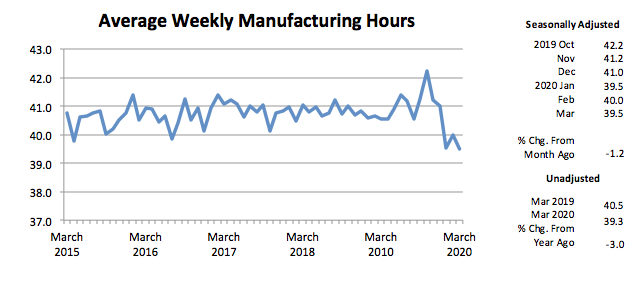
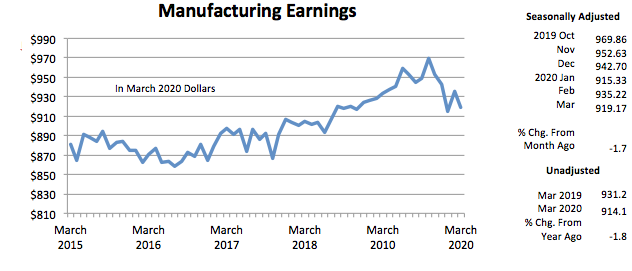
Average weekly Manufacturing Hours, after inching up in February, waned in March, sliding to 39.5. That matched January’s workweek and is the lowest since November 2009. Manufacturing Earnings, adjusted for inflation and seasonality, headed south for the fourth time over the last five months to $919.17. Average factory paychecks adjusted for only inflation are down almost 7 percent since reaching an all-time high of $980.31 last October.
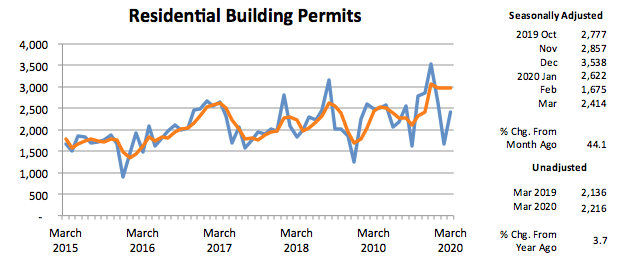
The adjusted Residential Building Permits staged a comeback in March, climbing to 2,414, which is slightly above the monthly four-year average between 2016 and 2019. Home-building permits, however, were down 8.5 percent during the first quarter compared to last year. Based on initial claims data by industry, in March home-building and other construction activity has been curtailed by the pandemic but much less than many other industries.
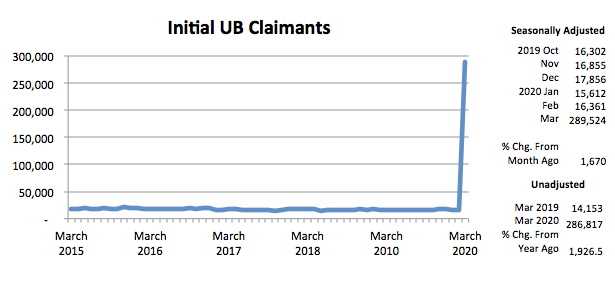
Adjusted Initial Claims for Unemployment Benefits (UB) rocketed up to never imagined heights in March, skyrocketing to 289,524 as layoffs swelled during the last two weeks of the month in response to the stay at home order. The highest monthly total before March was 47,548 in July 2011 when state government was shut down for 20 days, and state’s workforce filed for unemployment.
Initial claims during the Great Recession (December 2007 to June 2009) totaled 565,000 over the 19-month period. Since initial claims have continued to pour in during much of April, the combined total of the two months initial claims will top the combined Great Recession total. The sectors with the most initial claims in March were Accommodation and Food Services (66,000), Health Care and Social Assistance (42,000), Retail Trade (32,000), Other Services (25,000), Manufacturing (22,000), and Construction (17,000).
