

By Kelly Asche and Cameron Macht
September 2021
Ask business owners in Minnesota what their biggest challenge is today, and most will tell you that it is "finding help." Although much of the blame for this problem has been placed on the pandemic, the truth is that workforce shortages were already an issue in Greater Minnesota and have been since the end of the Great Recession.
Yes, people dropping out of the labor force due to the pandemic is part of the problem right now, but the more systemic reasons for workforce shortages are years of economic growth, an aging workforce heading toward retirement, and fewer young people to replace them. All these factors are putting significant pressure on Greater Minnesota's employers, making hiring significantly more challenging. This is not a short-term problem, but rather a long-term problem that will need various strategies if we are to overcome it.
Rural areas are experiencing an unprecedented number of job vacancies at a time when the growth in the number of people participating in the workforce is either slowing or declining. The annual average of quarterly job vacancies in the last three years is the highest it has been since DEED began measuring job vacancies in 2001. Regions in Greater Minnesota have some of the highest vacancy rates, putting serious pressure on employers in these areas who need to fill positions. The problem is only expected to get worse in rural regions due to a higher percentage of older workers compared to the Twin Cities metro area. When those workers retire, there are not enough younger workers to replace them.
Since 2005, the number of job vacancies has doubled in every region in Minnesota. Some of the largest growth has occurred in Southeast, Northwest, and Central Minnesota (Figure 1). Even though there was a slight dip in the number of job vacancies in 2020 due to the pandemic, it's projected that the numbers will show a significant rebound when the new job vacancy data for 2021 is released.
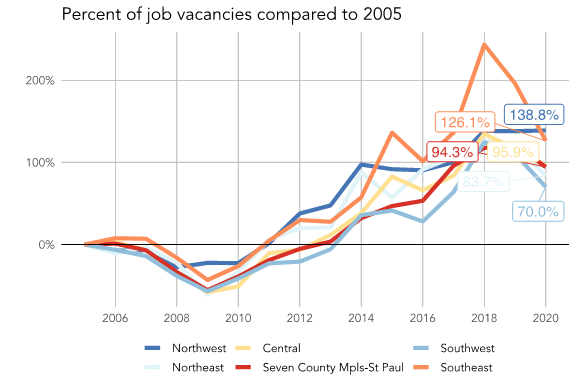
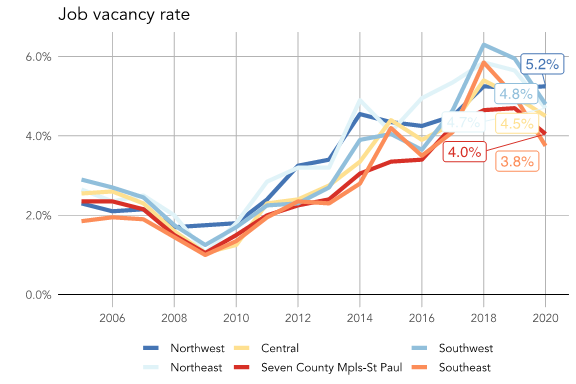
Although this growth is enormous, it doesn't show the true pressure employers are facing to fill jobs. The true pressure is measured using the job vacancy rate, which is the number of average quarterly job vacancies as a percentage of total jobs filled.
Figure 2 provides the rate for each planning region going back to 2005. Let's use Southwest as an example. In 2020, the job vacancy rate for this region was the highest in the state, 5.2%. What this means is that the average number of quarterly job vacancies was 5.2% of the total filled jobs in 2020 for Southwest Minnesota. That's very high. A vacancy rate of 3% is considered a healthy percentage to have in a region because it balances providing enough opportunity for workers while not stretching the labor pool so thin that there aren't any applicants for jobs.
When looking at vacancy rates, we find that the highest rates are located outside of the Twin Cities seven-county metro (Figure 2).
According to data from DEED's Local Area Unemployment Statistics program, Minnesota ended 2020 with an average of 3,095,000 workers. That was about 2,000 more workers than in 2019, narrowly extending the state's streak of 10 straight years of labor force growth coming out of the Great Recession. However, that annual average masks the declines that have been seen across the state as more workers have exited the labor force as the pandemic continues.
| Table 1. | Average Labor Force Through the First Seven Months of: | Change in Labor Force from: | |||
|---|---|---|---|---|---|
| - | 2021 | 2020 | 2019 | 2020-2021 | |
| Central | 386,360 | 395,342 | 397,446 | -8,982 | -2.3% |
| Northeast | 159,513 | 162,304 | 164,955 | -2,791 | -1.7% |
| Northwest | 296,654 | 300,650 | 305,530 | -3,996 | -1.3% |
| Southeast | 280,268 | 287,031 | 287,334 | -6,764 | -2.4% |
| Southwest | 212,372 | 219,489 | 222,799 | -7,117 | -3.2% |
| Twin Cities | 1,686,281 | 1,729,404 | 1,725,269 | -43,122 | -2.5% |
| Source: DEED Local Area Unemployment Statistics | |||||
Across the first seven months of 2021, the state's labor force declined by 2.9% in comparison to the first seven months of 2020, a loss of nearly 90,000 workers. Data show that every region has a smaller labor force than one year ago, with Southwest seeing the biggest decrease, and Northwest seeing the smallest (Table 1). Jobs are available, but so far, the workers to fill them are not.
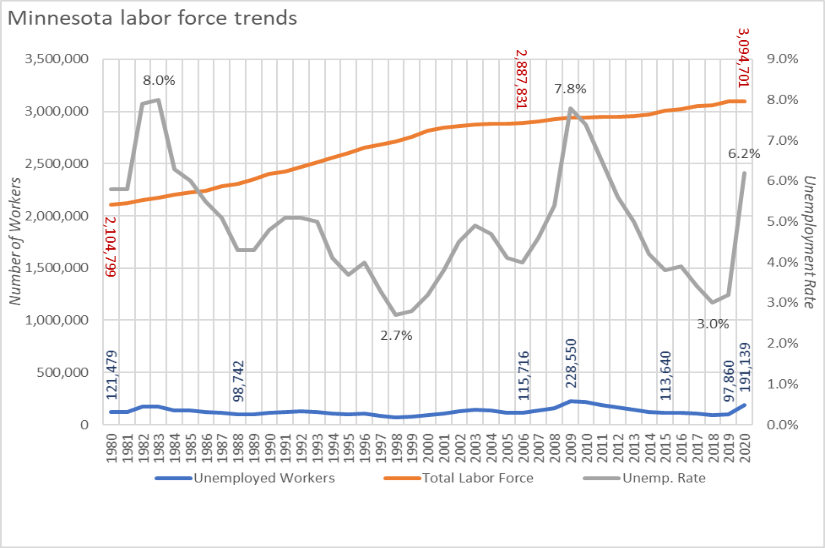
This lack of available workers coming out of a recessionary period is unique. Following the Great Recession, the number of unemployed workers in the state nearly doubled from 2006 to 2009 and remained elevated for another four years as the recovery slowly took hold. However, that turned into the longest running economic expansion in modern history, with the state's unemployment rate nearing historic lows and the number of unemployed workers falling back to numbers not seen since the late 1980s. Considering the state had gained nearly 800,000 additional workers over that 30-year period, the low unemployment rates and the scarcity of available jobseekers reflect an extremely tight labor market (Figure 3).
Though there was an initial surge in unemployed workers in the summer of 2020, unemployment rates have dropped back to pre-pandemic levels relatively quickly. By July of 2021, four of the five regions in Greater Minnesota recorded lower unemployment rates than in July 2019, prior to the pandemic. Only the Twin Cities and Central Minnesota still had higher rates, even though Central actually had fewer unemployed workers (but saw a higher rate because of the labor force declines as detailed in Table 1).
Due to the immediate impact of the pandemic, the state reported a drop of 35,000 fewer job vacancies in the second quarter of 2020 compared to 2019, but by the fourth quarter, the number of job openings was identical to the prior year. While job vacancies are back to pre-pandemic levels, the labor force has not fully recovered. Even when it does, this scarcity of available jobseekers is a long-term issue that has only been exacerbated by the pandemic. Sparing some other major economic shock, these tight labor market conditions are likely to be with us well into the future.
As shown in Figure 3, Minnesota employers were able to find talented workers from a steady stream of new workers over the past 40 years. This was due to several factors, including population growth and in-migration, high and rising labor force participation rates for females, and a stable flow of high school seniors and college students graduating into the workforce. Participation rates were also rising among the oldest age groups in the state, indicating workers were staying in the labor force longer.
However, the state's labor force growth slowed considerably, falling from an average of 41,000 new workers per year in the 1990s, to about 12,580 new workers per year in the 2000s (which included two recessions), before rising slightly to an average of about 15,500 new workers each year in the 2010s.
Looking ahead, growth in the state's labor force is expected to slow even more, down to an average of only about 7,500 new workers per year over this decade, based on projections made prior to the pandemic. However, the effects of the pandemic on the labor force may make that number of new workers even lower. A significant portion of the state's labor force growth was projected to be Baby Boomers staying in the workforce longer, but people in the oldest age groups (65+) have been dropping out faster than other groups due to COVID concerns. If they decide to retire for good, the state's labor force may grow even more slowly (Table 2).
| Table 2. Minnesota Labor Force Projections, 2020-2030 | 2020 Labor Force Projection | 2030 Labor Force Projection | 2020-2030 Change | |
|---|---|---|---|---|
| Numeric | Percent | |||
| 16 to 19 years | 171,577 | 169,441 | -2,137 | -1.2% |
| 20 to 24 years | 343,952 | 380,357 | +36,404 | +10.6% |
| 25 to 44 years | 1,240,067 | 1,296,630 | +56,563 | +4.6% |
| 45 to 54 years | 604,985 | 613,819 | +8,834 | +1.5% |
| 55 to 64 years | 564,859 | 493,365 | -71,494 | -12.7% |
| 65 to 74 years | 160,393 | 197,015 | +36,622 | +22.8% |
| 75 years & over | 26,195 | 37,088 | +10,893 | +41.6% |
| Total Labor Force | 3,112,028 | 3,187,715 | +75,687 | +2.4% |
| Source: calculated from Minnesota State Demographic Center population projections and 2015-2019 American Community Survey 5-Year Estimates | ||||
Almost all of the state's labor force growth was projected to happen in the Twin Cities metro area, as the area's population continues to grow because young people, families and immigrants continue to move in. In contrast, even Central Minnesota, which had been the fastest growing region of the state for the past couple decades, is projected to see a labor force decline over the next 10 years. Northeast is expected to see the biggest decline, due to an already older population and much less international in-migration.
As the past year has shown, Minnesota's short-term job growth has been dependent on the trajectory of COVID-19 cases in the state. Minnesota's job recovery from the pandemic accelerated during the first half of 2021 and is expected to continue to grow throughout the year. If growth continues, the state is expected to regain all jobs lost during the first two months of the pandemic by the end of 2022, but not all industries are expected to recover fully, and different regions will also see varying rates of recovery due to their unique industry mix and labor force constraints.
While the outlook projects strong growth, it is important to understand that these employment projections are assuming that workers come back into the labor force in large enough numbers to meet the forecasted job gains. There are indications that the constraints on job growth are more on the supply side than the demand side for some industries at this point in the rebound. Vacancies don't count as jobs until they are filled, and many jobs in the state remain unfilled.
To entice workers, employers are using several methods. One can think of these methods as "levers" that can be pulled: increasing wages and benefits, decreasing experience or educational requirements, and offering on-the-job training are all practical ways for employers to set themselves apart from other competing available jobs. And the data show that employers are using these levers to a great extent, particularly where the job vacancy rates are the highest.
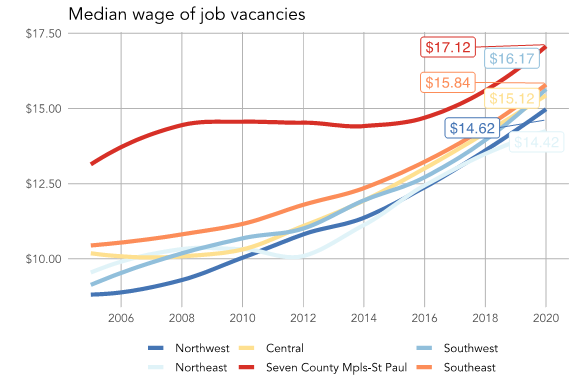
Figure 4 provides the median wages for job vacancies in each region. Wages have increased significantly over the last five years as the demand for workers has increased. The largest increases in wages have occurred in Greater Minnesota, where the workforce shortage became an issue earlier than it did for metropolitan counties. In 2005, the gap in median wages for job vacancies between the seven-county metro and the region with the lowest median wage (Northwest) was $3.40. By 2020, that gap had shrunk to $2.70.
In addition to wages, there has been a large increase in the number of job vacancies offering health care benefits.1
There are other levers that can be pulled by employers to increase their applicant pool as well. Work experience and higher education requirements for open positions have decreased, opening eligibility to potential workers who may have been reluctant to apply because they didn't believe they were qualified.
Figure 5 provides the percentage of job vacancies requiring post-secondary education or previous work experience. As the trend lines show, the percentage of job vacancies requiring either of these has decreased significantly across Minnesota.
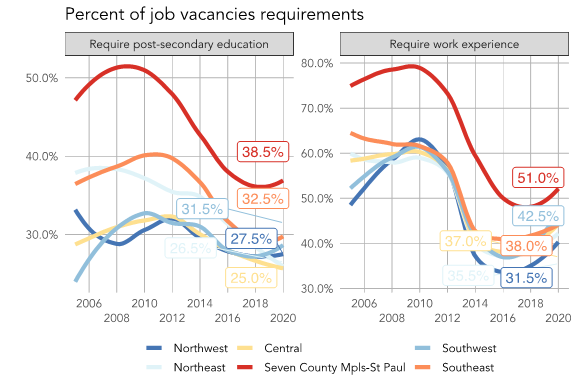
Is this due to an increase in "low-skilled" positions? The data show that this trend has occurred in occupations of all skill levels across all regions of Minnesota,2 showing that using job position requirements as an indicator of whether a position is "low-skilled" or otherwise is unwise. Research has shown that employers regularly use education and experience requirements to increase and decrease the applicant pool, even for occupations most would consider "high-skilled."
Workforce shortages are not going away anytime soon. The demographic and economic trends have pushed Minnesota into this territory, and the same level of pressure felt in Greater Minnesota will likely hit the Twin Cities metro in the next five years. Any workforce development organization or expert will tell you that relieving this pressure will take a multi-pronged approach, and fortunately, many of our regions are engaging in these activities already. Resident recruitment initiatives, welcoming initiatives for immigrant and refugee populations, programs to increase housing development and child care availability, and automation are all strategies that will play an essential role if Minnesota is to continue filling its workforce needs.
After receiving his Master's of Public Policy at the Humphrey School of Public Affairs, Kelly was hired as the Research Associate at the Center for Rural Policy and Development and moved to the best city in Minnesota, New London. Kelly's work at the Center for Rural Policy and Development is focused on data analysis, busting myths related to the rural narrative, and researching policy issues related to rural economic development, health care, and agriculture.
During his off time, you will likely find Kelly floating in his kayak, bicycling across rural Minnesota, gardening, spending time with his wife and cat, and generally shying away from places where there are large amounts of people.
Cameron supervises a team of regional analysts that provide labor market information to support workforce and economic development efforts across the state. He has nearly 20 years of experience working in DEED's LMI office, as well as prior career practice in marketing, market research, and economic development. He has a bachelor's degree in organizational management and marketing from the University of Minnesota-Duluth.
1 www.ruralmn.org/finding-work-or-finding-workers-pt-1
2 www.ruralmn.org/finding-work-or-finding-workers-pt-1