by Tim O'Neill
June 2020
On March 16, 2020, Emergency Executive Order 20-04 called for the temporary closure of bars, restaurants, and other places of public accommodation throughout the State of Minnesota. Subsequent measures would be taken to ensure the health and safety of Minnesotans were not part of the COVID-19 pandemic, including a stay-at-home order on March 25. With the unfolding of these events, labor markets throughout the state, including within the Twin Cities Metro Area, made a sudden and dramatic shift.
One of the most dramatic shifts in the labor market was the unprecedented spike in initial unemployment insurance (UI) claims, as workers throughout the state and Metro Area were furloughed or laid off. More specifically, between March and April nearly 360,000 people filed initial claims for UI in the Metro Area. This represented fully one-fifth of the region's 2019 annual labor force size (see Table 1). To get a scope for just how extraordinary this spike was, about 37,400 claims were filed over March and April in 2009, the height of the Great Recession. The number of UI claims over March and April of 2020 nearly matched the 372,500 UI claims during all of 2009 and 2010. From another angle, 28 times more UI claims were filed in March and April of 2020 then there were during that same period in 2019.
Overall, about three in every five of the nearly 614,000 UI claims filed in Minnesota over March and April occurred in the Metro Area. Over 40 percent of the Metro Area's UI claims were in Hennepin County, with another 17 percent in Ramsey County. Being the most-populated counties in the state, it makes sense to see Hennepin and Ramsey counties top the list. Analyzing claims as a share of their respective 2019 annual labor force size, Anoka County, Ramsey County, and Scott County were the hardest hit. Carver County was the least impacted within the Metro Area. This may, in part, be because of its higher concentration of employment in manufacturing compared to Other Services, Accommodation and Food Services, and Arts and Entertainment, which were harder hit industries in the region.
Table 1. Initial Unemployment Insurance Claims by Metro Area County, March and April 2020| Area | 2020 UI Claims for March and April | 2019 UI Claims for March and April | 2009 UI Claims for March and April | 2020 UI Claims as Share of 2019 Labor Force |
|---|---|---|---|---|
| Anoka County | 42,691 | 1,732 | 5,295 | 21.5% |
| Carver County | 10,181 | 355 | 1,250 | 17.4% |
| Dakota County | 50,471 | 1,946 | 5,302 | 20.8% |
| Hennepin County | 148,560 | 4,731 | 14,727 | 20.9% |
| Ramsey County | 62,065 | 2,265 | 6,253 | 21.2% |
| Scott County | 17,628 | 572 | 1,792 | 21.0% |
| Washington County | 27,591 | 1,034 | 2,745 | 19.2% |
| Metro Area | 359,187 | 12,635 | 37,364 | 20.7% |
| Minnesota | 613,917 | 27,534 | 77,991 | 19.7% |
| Source: DEED Unemployment Insurance (UI) Statistics | ||||
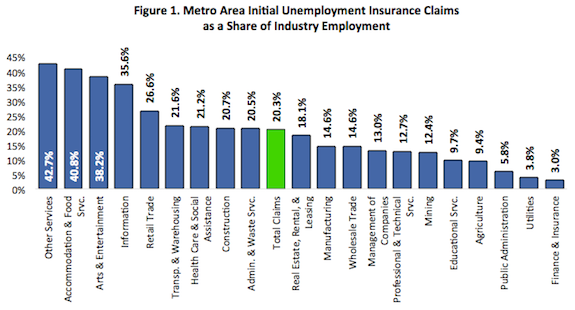
As Carver County shows, local employment share in several select industries had a significant relationship to overall UI claims filed. As Figure 1 highlights, UI claims were highly concentrated within Other Services, Accommodation and Food Services, Arts and Entertainment, Information, and Retail Trade. For example, initial UI claims filed in March and April by workers in Other Services which includes among other industries auto repair, barber shops and beauty salons, and laundry services, accounted for nearly 43 percent of that industry's total Metro Area employment in 2019. The personal care services in Other Services were ordered to close on March 18 by Emergency Executive Order 20-08. UI claims accounted for about 41 percent of the Metro Area's 2019 employment in Accommodation and Food Services and for about 38 percent of the region's 2019 employment in Arts and Entertainment.

UI claims filed during the eight weeks of March and April accounted for over one-third of Information's total Metro Area employment in 2019. Many of these claims were likely filed by those working in movie theaters and libraries. Meanwhile, claims made up over one-fourth of Retail Trade's total employment, with closures and restrictions placed on clothing stores, sporting goods stores, department stores, and others. Beyond these five mentioned industry sectors, four more experienced a higher-then-average share of UI claims: Transportation and Warehousing, Health Care and Social Assistance, Construction, and Administrative and Waste Services. Initial UI claims in March and April accounted for about one-fifth of the respective total employment for each of these industry sectors. Layoffs and furloughs in these industries are most likely from complications around social distancing requirements.
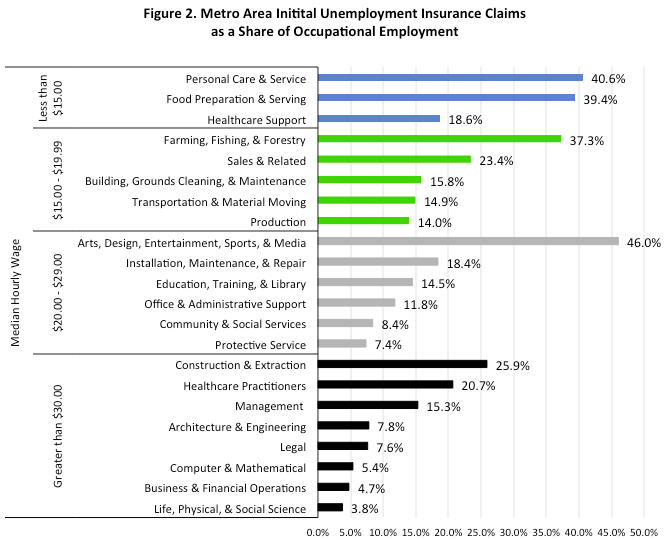
Along with industry distribution, initial UI claims can also be analyzed by occupational distribution. For example, of 22 major occupational groups, Arts, Design, Entertainment, Sports, and Media occupations had the highest share of workers filing for UI benefits in the Metro Area, with nearly half of such workers doing so. Personal Care and Service; Food Preparation and Serving; and Farming, Fishing, and Forestry each had between 37 and 41 percent of their respective employment shares filing for UI benefits. While those filing for UI benefits came from all industries and occupational groups, a higher share of such workers came from lower-paying industries and occupations. Overall, those occupational groups with a median hourly wage of less than $20.00 account for about 42 percent of the Metro Area's total employment. Yet these same occupations accounted for about 56 percent of those UI claims filed in the region over March and April. At the other end of the spectrum, those occupational groups with a median hourly wage greater than $30.00 account for about 32 percent of the Metro Area's total employment. Yet these occupations accounted for about 23 percent of UI claims filed over March and April (see Figure 2).

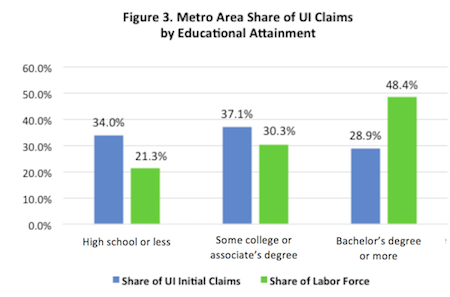
Beyond industry and occupational distribution, DEED's Unemployment Insurance Statistics allow us to study recent and historical UI applications by education, age, gender, race, and ethnicity. For example, the recent spike in UI applications reveals a higher share of such applicants with lower levels of educational attainment. According to 2018 American Community Survey (ACS) 5-Year Estimates, about 21 percent of the Metro Area's labor force has a high school diploma or less. However, over one-third of the UI claims filed in March and April were from those with a high school diploma or less. Similarly, while those with some college or an associate degree make up about 30 percent of the Metro Area's labor force, over 37 percent of recent UI claims were filed by those with such educational attainment. Finally, where over 48 percent of the Metro Area's labor force has a bachelor's degree or more, those with such education only accounted for about 29 percent of recent UI claims (see Figure 3). To put this data simply, pandemic safety measures across the Metro Area disproportionately impacted those with less education and lower incomes. Again, this is largely because those industries and occupational groups were most affected by recent closures and restrictions.

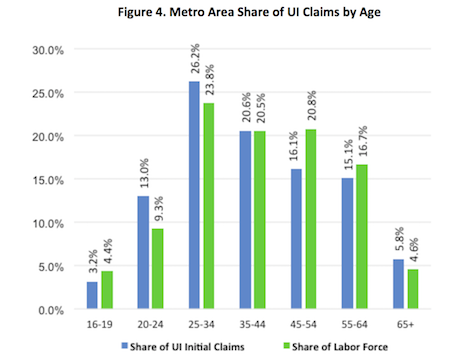
When broken down by age, the distribution of recent UI claims in the Metro Area closely resembles that of the labor force at large. There is a slightly higher share of claims among those ages 20 to 24 and 25 to 34. Meanwhile, a slightly lower share of claims were filed by those ages 45 to 54 and 55 to 64 (see Figure 4). These differences may, in part, be caused by industry and occupational age distribution. Harder hit industries, such as Accommodation and Food Services, typically employ younger workers. At the same time, older workers may be better insulated from layoffs and furloughs by seniority and skillsets than their younger counterparts.

When the data are broken down by gender, the share of UI applicants in the Metro Area is nearly reverse that of the region's labor force distribution. More specifically, males account for about 52 percent of the region's labor force and accounted for about 47 percent of recent UI claims. Females account for about 48 percent of the region's labor force and accounted for about 53 percent of recent UI claims.
The data by race and ethnicity show a higher share of minority workers were applying for UI benefits in March and April. From the 2018 ACS 5-Year Estimates, about 23 percent of the Metro Area's labor force reports as something other than White, not Hispanic or Latino. However, this population made up about 36 percent of recent UI claims.
COVID-19,and resulting pandemic safety measure, have greatly impacted the Metro Area's labor market. Workers in every industry and occupational group have felt its effects. This article shows, however, that certain industries and occupational groups were more severely impacted than others. UI data also reveal how different populations within the labor market have been affected. As we enter the summer months, we will continue to keep an eye on UI trends within the Metro Area and across Minnesota. Learn more about applying for UI benefits, Workers and businesses can also learn more about safely returning to work at DEED's main website.