by Amy Gehring
March 2013
Of the 134,215 students who enrolled in classes at Minnesota community and technical colleges in the fall of 2009, nearly 60 percent did not return to classes at those schools the following fall. DEED took a look at how they fared professionally afterward.
Minnesota has 30 two-year community and technical colleges (CTCs) spread over 47 campuses statewide. These colleges, part of the Minnesota State Colleges and Universities system (MnSCU), offer general education and career-related associate degrees, certificate programs of up to two years, and non-award programs. They have the highest number of enrolled post-secondary students of any college or college system in Minnesota. During the 2009-10 school year, 134,215 students were enrolled in a Minnesota CTC, taking more than 835,000 credits in the fall semester.
Of the students who enrolled at CTC institutions in the fall of 2009, 77,805 (58 percent of the total) did not return to a Minnesota post-secondary institution the following fall. This article will look more closely at that group of students and explore what they were doing after spring of 2010.
The study group was 57 percent female and 76 percent white. African American students made up the second-largest racial group, accounting for 9 percent of the students. The vast majority (92 percent) were resident students paying in-state tuition. Just over half (51 percent) of the study group was enrolled full time.
Over half (55 percent) of the study group was enrolled at a CTC in the Twin Cities. The area with the next largest group was northwestern Minnesota, with 13 percent of the students. The Twin Cities was also where a majority of the traditional-aged students attended school. Students 25 and older are considered nontraditional and made up just under half of the study group. Older students were more likely to be attending school in southwestern or southeastern Minnesota, while students younger than 19 were more likely to be in a school in northwestern and northeastern Minnesota.
Three-quarters (77 percent) of our study group identified a course of study and declared at least one major. This may be the best, although far from perfect, measure we have of student intention. Table 1 shows this group's top 10 programs of study.
| Top 10 Programs of Study | |
|---|---|
| Count | Program |
| 21,554 | Liberal Arts and Sciences/Liberal Studies |
| 4,828 | Nursing/Registered Nurse |
| 3,200 | Licensed Practical/Vocational Nurse Training (LPN, LVN, Cert., Dipl, AAS) |
| 2,081 | Business Administration and Management, General |
| 1,564 | Accounting |
| 1,446 | Criminal Justice/Police Science |
| 1,043 | Computer Systems Networking and Telecommunications |
| 830 | Criminal Justice/Safety Studies |
| 746 | Engineering, General |
| 710 | Marketing/Marketing Management, General |
| Source: Minnesota Office of Higher Education | |
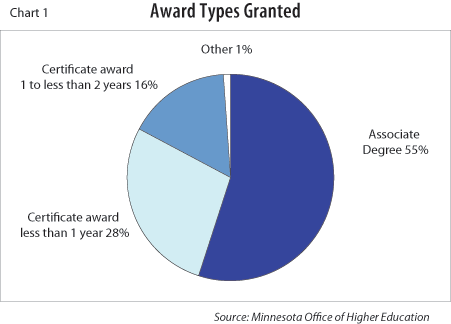
About 10 percent of the study group (7,455 students) received an award or degree in the 2009-10 school year. Chart 1 breaks these awards into four categories: associates degree, certificate award of less than one year, certificate award of one to less than two years, and other.

Women were a larger share of the graduates (63 percent) than men in our study group. The racial makeup of graduates, however, did not differ significantly from the distribution in the total population, nor did citizenship status. Most of these graduates (93 percent) identified themselves as degree-seeking. The remaining 7 percent of graduates in the study group did not claim to be degree-seeking.
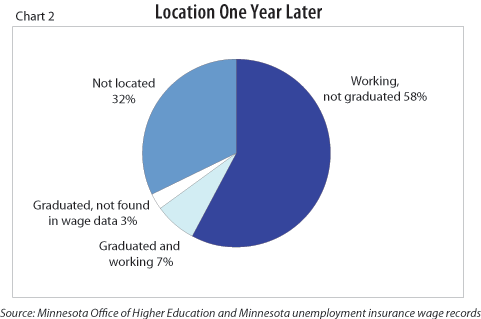
How many of our total study group had found employment by the fourth quarter of 2010? Of the original 77,805 students, 76,554 or 98 percent have valid Social Security numbers in our databases that can be used to link to wage records. Of these, 50,361 (two-thirds) were employed in Minnesota during fourth quarter 2010. Another 143 were employed in other states.1 Most of those who were working did not graduate from their programs (see Chart 2). Another 7 percent graduated and found work, and 3 percent graduated but do not appear in the Minnesota wage data or the wage data that we have access to for other states. In summary, one-third of these former students cannot be located in the graduate listings, Minnesota wage data, or wage record data for the other 22 states that participate in the wage records interchange system.

This section compares wage outcomes for those in our study group who graduated and those who did not graduate. Table 2 displays the top 11 programs of study by enrollment in fall 2009 along with the number of graduates, the number employed in fourth quarter 2010 and the median quarterly wages for both graduates and non-graduates in our study group.
| Wage Outcomes for Top 11 Programs of Study | |||||
|---|---|---|---|---|---|
| Program | Number Enrolled | Graduates | Number Employed | Median Quarterly Wage for Graduates | Median Quarterly Wage for Non-Graduates |
| Liberal Arts and Sciences/Liberal Studies | 21,554 | 1,407 | 14,970 | $3,629 | $3,215 |
| Nursing/Registered Nurse | 4,828 | 949 | 3,759 | $4,185 | $4,566 |
| Licensed Practical/Vocational Nurse Training (LPN, LVN, Cert., Dipl, AAS) | 3,200 | 275 | 2,303 | $3,571 | $3,889 |
| Business Administration and Management, General | 2,081 | 225 | 1,485 | $6,966 | $4,559 |
| Accounting | 1,564 | 128 | 1,043 | $5,439 | $4,597 |
| Criminal Justice/Police Science | 1,446 | 123 | 1,040 | $4,959 | $3,538 |
| Computer Systems Networking and Telecommunications | 1,043 | 42 | 628 | $5,895 | $4,353 |
| Criminal Justice/Safety Studies | 830 | 41 | 556 | $4,824 | $3,860 |
| Engineering, General | 746 | 51 | 444 | $2,056 | $3,453 |
| Marketing/Marketing Management, General | 710 | 72 | 542 | $6,756 | $3,976 |
| Automobile/Automotive Mechanics Technology/Technician | 706 | 23 | 431 | $2,843 | $3,182 |
| Source: Minnesota Office of Higher Education and Minnesota unemployment insurance wage records | |||||
For these 11 programs, graduates earned an average of $721 a quarter more than those who did not graduate. But in programs for registered nurses (RNs), licensed practical nurses (LPNs), engineers and automotive mechanics, graduates earned less on average than non-graduates. What is the explanation for this?
One likely possibility is that many of these students were already employed in the profession when they enrolled in school. They went back to school either to enhance their existing skills or to learn new ones, not to receive a degree or obtain a license to practice.
An examination of RNs in the study group verifies this theory. It is clear from wage record data over a three-year period prior to 2009 that non-graduate RNs had been working with their employers in the health care industry for an average of three years longer than graduates in our study group. Since RNs need at least a two-year degree and a license to practice, we can assume that the vast majority of RN non-graduates already were working as RNs prior to 2009-10. This indicates that many people utilize Minnesota's community and technical colleges not necessarily to earn a degree, but to develop their careers and enhance their skills.
Analyzing wage and employment outcomes for non-graduates is challenging because it is difficult to know from the data why they entered the program. It is unclear how many of those who declared a major intended to complete a degree. Wage outcomes demonstrate that many of those who did not complete a degree in fact had better wage outcomes than those who did. One explanation is that they were already employed in the field and were in school only to enhance or refresh their skills in their existing occupations. In other fields, however, graduates did see a significant wage premium over non-graduates within the same cohort.
1The Wage Record Interchange System (WRIS) facilitates the exchange of wage data among participating states for the purpose of assessing and reporting on state and local employment. Twenty-two states are participating in WRIS2.