by Dave Senf
December 2013
Monthly analysis is based on unadjusted employment data.
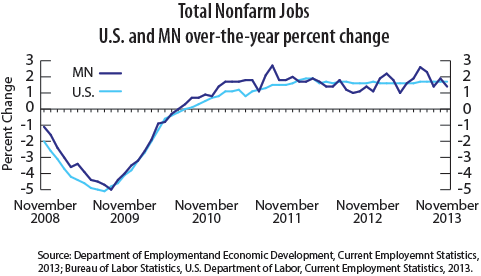
Employment in the Minneapolis-St. Paul-Bloomington MSA slipped 6,604 (0.4 percent) over the month of November and was up 32,818 (1.8 percent) over the year. Private employment dropped 7,234 (0.5 percent) for the month and was up 31,589 over the year (2.0 percent). Government employment increased 630 (0.3 percent) in November and 1,229 (0.5 percent) for the year. Four private sectors lost jobs in November. Leisure and Hospitality employment dropped the most, declining by 6,112 jobs (3.6 percent). The other job losers were Mining, Logging, and Construction (down 3,879, 5.5 percent), Professional and Business Services (down 1,278, 0.5 percent), and Financial Activities (down 281, 0.2 percent). The big job gainer in November was Trade, Transportation, and Utilities (up 3,079, 1.0 percent). Local Government Education added 1,326 jobs (1.5 percent). All private sectors have added jobs over the year with Educational and Health Services (11,620), Leisure and Hospitality (6,034), Mining, Logging, and Construction (5,093), Professional and Business Services (3,923), and Manufacturing (2,189) leading the way. Government employment is up 1,229 from a year ago with all the growth occurring in Local Government. Federal Government employment is down 336 jobs, State Government is down 406 jobs, and Local Government employment is up 1,971 from a 2,176 increase over the year in Local Government Education employment.
Employment in the Duluth-Superior MSA climbed 579 (0.4 percent) over the month and 1,576 (1.2 percent) over the year. Over the month Private Sector employment rose 381 (0.4 percent) while Government employment climbed 198 (0.7 percent). Gains in the Private Sector were reported by Trade, Transportation, and Utilities (768), Educational and Health Services (163), and Information (105). Job losses were highest in Leisure and Hospitality (257), Mining, Logging, and Construction (242), Professional and Business Services (88), and Manufacturing (74). State Government employment (89) and Local Government employment (145) additions offset a Federal Government employment (36) decline. Over the year the Private Sector added 1,576 jobs (1.2 percent) while Government employment slipped by 328 jobs (1.2 percent). Mining, Logging, and Construction employment fell the most over the year (345, 4.3 percent) while Leisure and Hospitality added the most jobs (1,650, 12.3 percent).
Employment in the Rochester MSA was basically unchanged in November as employment dropped by only 50 jobs over the month (0.0 percent) and increased 0.4 percent (452) over the year. Government employment rose 93 (0.9 percent) over the month, but Private Sector employment dropped 0.1 percent (143 jobs). Job cuts were highest in Manufacturing (down 232, 2.3 percent) and Professional and Business Services (down 170, 3.3 percent). The only significant job growth was in Trade, Transportation, and Utilities (up 531, 3.2 percent). Over the year Private Sector employment increased 452 (0.4 percent) with Trade, Transportation, and Utilities adding 650 jobs while Manufacturing cut 222 jobs. Government lost 358 jobs over the year with all three levels of government (Federal, State, and Local) cutting jobs.
Employment in the St. Cloud MSA tailed off 251 (0.2 percent) over the month and increased 1,722 (1.7 percent) over the year. Government employment rose 182 (1.1 percent) from October while the Private Sector cut 455 jobs (0.5 percent). Employment dipped the most in Mining, Logging, and Construction (299, 4.9 percent) and Educational and Health Services (237, 1.2 percent). Hiring was highest in Trade, Transportation, and Utilities (457, 2.1 percent). State Government payrolls (125, 2.5 percent) expanded the most on the Public Sector side. Over the year employment growth was concentrated in the Private Sector as Government employment was up only 61 jobs from a year ago. Educational and Health Services (856), Mining, Logging, and Construction (803), and Trade, Transportation, and Utilities (381) added the most workers over the year.
Employment in the Mankato-North Mankato MSA inched down 33 jobs (0.1 percent) over the month and increased 379 (0.7 percent) over the year. The Private Sector added 27 jobs last month (0.1 percent). Government employment decreased 60 jobs (0.6 percent) during November. All of the Private Sector gain was in Service-Providing industries (up 97, 0.3 percent). Over the year growth was mainly in the Private Sector which added 306 jobs (0.3 percent) while Government employment rose 73 (0.8 percent).
Employment in the Fargo-Moorhead MSA dipped 444 (0.3 percent) over the month and 2,453 (1.90 percent) over the year. Government employment increased 144 (0.8 percent) over the month while Private Sector employment declined 588 (0.5 percent). The leading job generators over the month were Trade, Transportation, and Utilities (up 448, 1.5 percent) and Educational and Health Services (up 129, 0.6 percent). Job cuts were largest in Mining, Logging, and Construction (down 356, 3.6), Professional and Business Services (down 245, 1.6 percent), and Manufacturing (down 64, 0.6 percent).
Employment in the Grand Forks-East Grand Forks MSA increased 322 (0.6 percent) over the month and 1,076 (1.9 percent) over the year. Government employment increased 138 (0.9 percent) in November while Private Sector employment jumped 184 (0.4 percent). Most of the monthly private employment gains were in Trade, Transportation, and Utilities (up 444, 3.4 percent) while job declines were mostly in Mining, Logging, and Construction (down 259, 5.0 percent) and Manufacturing (down 89, 2.3 percent).
