Minnesota Economic Indicators
by Dave Senf
January 2016
Note: All data except for Minnesota’s PMI have been seasonally adjusted. See the feature article in the Minnesota Employment Review, May 2010, for more information on the Minnesota Index.
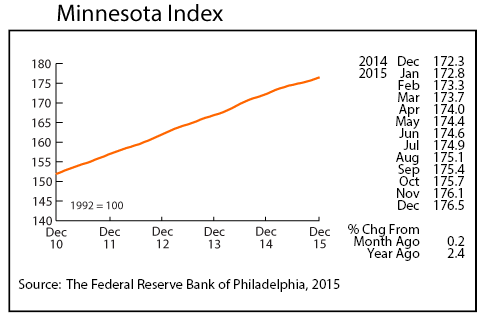
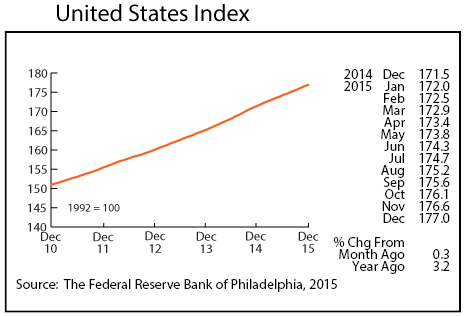
The Minnesota Index rose 0.2 percent for the fourth consecutive month in December boosted by another solid month of wage and salary employment, a jump in average weekly manufacturing hours, and the fourth straight month with a decline in the unemployment rate. December’s 3.5 percent seasonally adjusted unemployment rate is the lowest in over 14 years. The U.S. index advanced 0.3 percent.
The Minnesota Index, which is a proxy for economic growth in Minnesota, increased 2.8 percent on an annual average basis last year. This growth rate will likely be revised upwards when wage and employment numbers are revised upwards in March. The index, which has increased between 3.1 and 3.3 percent during the previous five years, expanded 3.1 percent in 2014. The U.S. index increased 3.5 percent last year for the second year in a row. Annual average gains by Minnesota’s index exceeded U.S. gains between 2011 and 2013 but have lagged U.S. gains over the last two years.
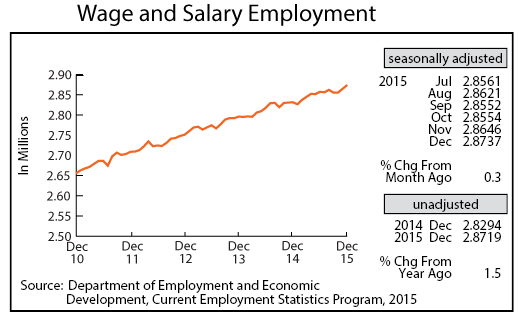
Adjusted Wage and Salary Employment surged for the second straight month in December with 9,100 jobs added. December’s elevated gain followed 9,200 jobs created in November. December’s payroll expansion was split between the private and public sectors with private payrolls up 4,800 and government payrolls up 4,300. Only three sectors cut payrolls with Professional and Business Services, Leisure and Hospitality, and Trade, Transportation, and Utilities accounting for most of the cutbacks. Job growth was strong in Leisure and Hospitality, Educational and Health Services, Financial Activities, Manufacturing, and Construction.
Local government accounted for almost all of the jobs added in the public sector.
Minnesota’s unadjusted over-the-year job growth ticked up to 1.5 percent in December compared to 1.9 percent nationally. Minnesota’s annual average job growth last year was 1.4 percent compared to 2.1 for the nation. Minnesota’s job growth has now lagged behind the national rate by a wide margin for two consecutive years. The last two-year period in which Minnesota job growth fell behind U.S. job growth as much as over the last two years was in 1982-83. Minnesota has added 213,000 jobs on an annual average basis between 2010 and 2015. That is an 8.1 percent expansion compared to 9.0 percent for the U.S. Initial work indicates that Minnesota’s recent job growth will be revised upwards when employment numbers are benchmarked in March, decreasing the disparity between state and national job growth over the last few years.
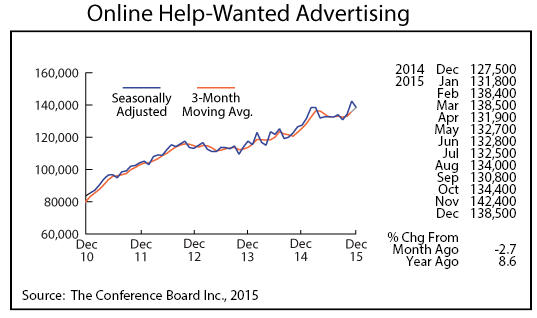
Minnesota’s adjusted online Help-Wanted Ads retreated from November’s record high to 138,500 in December. Labor demand, as indicated by online job advertising, remains strong in Minnesota. Online postings averaged 134,900 monthly last year, an 11.1 percent increase from the 2014 monthly average. Nationwide online job postings were up 6.7 percent in 2015 compared to Minnesota’s 11.1 percent increase, suggesting that Minnesota’s slower job growth last year was in part from Minnesota employers having a harder time filling job vacancies caused by the state’s tighter job market.
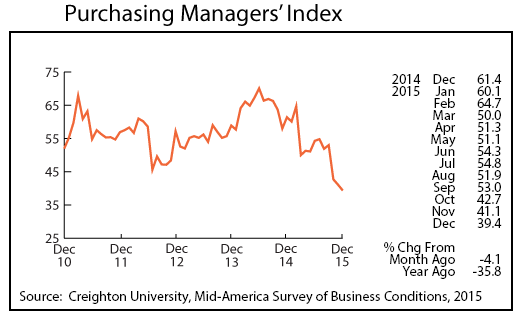
Minnesota’s Purchasing Managers’ Index (PMI) dipped for the fourth time over the last five months, decreasing to 39.4 in December, its lowest reading since March 2009. Slow global growth combined with a strong dollar has cut into Minnesota manufacturing exports. After setting an annual average record-high in 2014 of 64.4, the index slipped to 51.2 for 2015. The average annual reading over the 21-year series is 53.7.
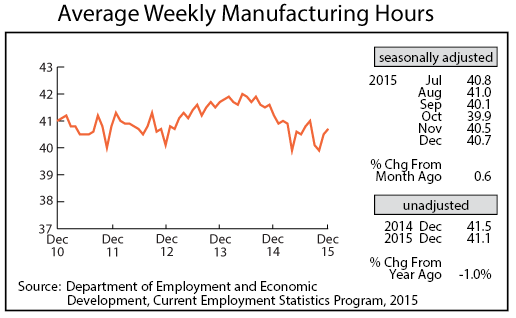
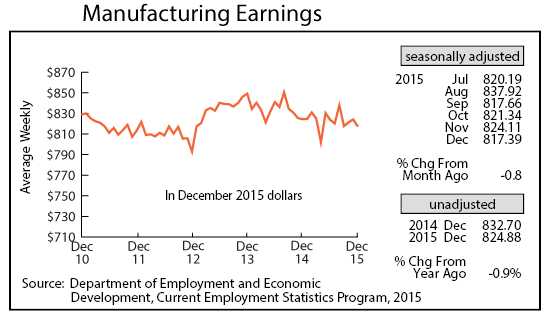
Adjusted Manufacturing Hours, however, are on the rebound having moved upwards over the last two months. December’s 40.7 hours factory workweek is the longest since August and may be hinting at an uptick in manufacturing activity. Average weekly Manufacturing Earnings zigzagged down in December, tailing off to $817.39. That is the lowest factory paycheck since April and 0.8 percent lower than a year ago after accounting for inflation.
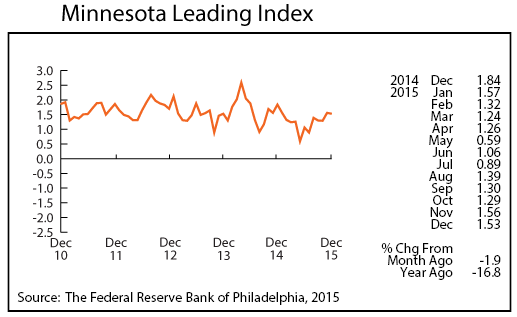
The Minnesota Leading Index fell slightly in December but remains healthy at 1.53. That reading predicts that Minnesota’s economy will expand by 1.5 percent over the next six months.
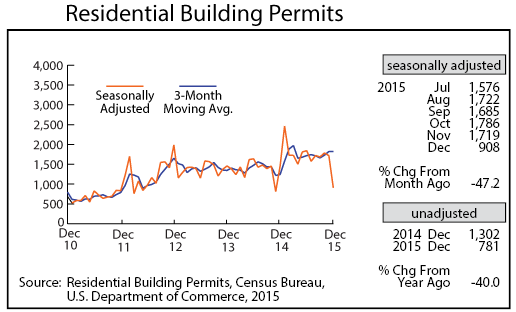
Adjusted Residential Building Permits unexpectedly crashed in December, plunging by 47.2 percent to 908. The decline was especially surprising given the warm weather in December. Despite the drop off in December, building permits reached 20,475 last year, a 24 percent increases from 2014.
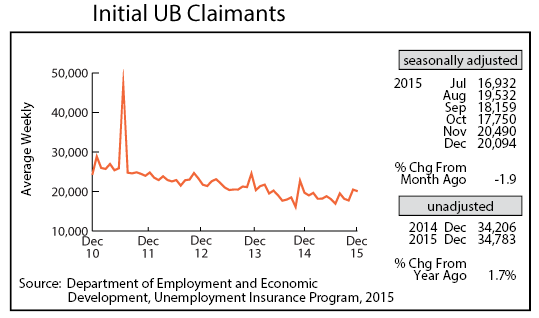
Adjusted Initial Claims for Unemployment Benefits (UB) inched down in December to 20,094. Initial claims averaged 18,743 a month in 2015, down 4.3 percent from 2014 monthly average. Last year was the lowest year for initial claims since 2000.
