by Dave Senf
December 2018
Employment in Minnesota is spread across just over 800 occupations as defined by the Standard Occupational Classification (SOC) system.1 The system is used to classify workers into occupational categories for the purpose of collecting, calculating, and disseminating data on occupational employment. Occupational data are gathered through the Occupational Employment Statistic program (OES) and include information on occupational employment across industries.2
Occupation employment across industries data, known as industry staffing patterns, show for each industry the mix of occupations in which workers are employed.3 For example, Minnesota's private hospitals employed roughly 107,000 employees in 2016 spread across 304 occupations. The top hospital occupation, with 31,000 jobs, was, not surprisingly, registered nurses. Registered nurses accounted for 29 percent of the private hospital industry staff followed by nursing assistants (7.0 percent), physicians and surgeons (2.7 percent), and medical secretaries (2.7 percent).
Almost half of the 65,400 working registered nurses in the state were employed at private hospitals. The next largest employer of register nurses was the ambulatory health care services industry with 23 percent of all registered nurses and then offices of physicians with 15 percent. The sixth largest employer of registered nurses was government which employed 5.2 percent of all registered nurses. Public sector registered nurses work primarily at public hospitals but also in other government agencies such as school districts, counties, and cities.
Industry staffing patterns are available for 270 industries, including eight government industries.4 The staffing patterns for the government industries allows us to identify which occupations are primarily public sector occupations as well as which occupations are primarily found in the private sector. Everybody already knows that most teachers are employed in our local school districts, but the staffing pattern data put actual numbers and percentages to the public and private sector mix of all occupations.
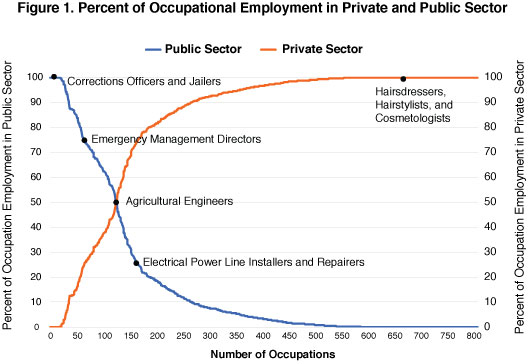
Some occupations, such as hairdressers, hairstylists, and cosmetologists or team assemblers are employed only in the private sector. Jobs in other occupations, such as tax examiner, collector, and revenue agent or correctional officer and jailer, exist only in the public sector at least in Minnesota since currently there is no private correction facility operating in the state unlike in a number of other states. Some occupations, like agricultural engineers, are employed equally in the private and public sector. Figure 1 displays a publicly versus privately employed breakdown for Minnesota's 800 occupations. There are about 20 occupations that are strictly public sector occupations including corrections officers and jailers. On the other end, there are 218 occupations that are strictly found in the private sector, including hairdressers, hairstylists, and cosmetologist. Half of the 38 people working as agricultural engineers in the state were employed in private industry while the other half worked in government offices. Emergency management directors were split 75 to 25 percent as far as public versus private employment while electrical power line installers and repairers had the opposite mix with 25 percent on public payrolls and 75 percent on private payrolls.

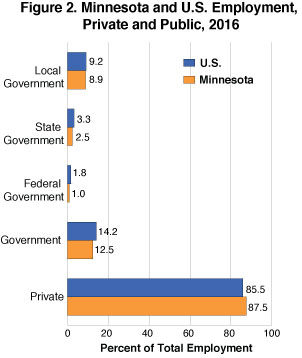
For most occupations more jobs are in private companies than in government. As shown in Figure 1 public sector employment is higher than private employment in only 120 occupations. That means that in the other 680 occupations more workers are privately employed rather than publicly employed. That really shouldn't be a surprise as 87.5 percent of the 3.1 million jobs in Minnesota in 2016 were in the private sector. Minnesota's private sector share of total employment is slightly higher than the nationwide share of 85.8 percent. Government employment in Minnesota accounted for 12.5 of total employment in 2016 while accounting for 14.2 percent of total U.S. employment. Figure 2 compares Minnesota and the U.S. mix of private and public employment in 2016 with a little more detail by breaking up government jobs into three levels: federal, state, and local.

Employment data utilized here are from the 2016 - 2026 employment projections (EP) for Minnesota and the U.S. Unlike the commonly used Quarterly Census of Employment and Wages (QCEW) and Current Employment Statistics (CES) data, employment projection data include self-employment. Table 1 compares the mix of private and public employment for 2016 employment projection data and 2017 employment data from four other commonly used employment series. Self-employed jobs are only included in the American Community Survey and EP data. There are minor differences in which certain private and public employment is and isn't included in the employment series leading to the slight variation in the public and private mix.5
| Table 1. Minnesota Private and Public Sector Employment, 2017 | ||||||
|---|---|---|---|---|---|---|
| - | CES | ACS | QCEW | BEA | Average* | Projections** |
| Private | 85.5 | 88.3 | 86.6 | 88.6 | 87.3 | 87.5 |
| Public | 14.5 | 11.7 | 13.4 | 11.4 | 12.7 | 12.5 |
| Federal | 1.1 | NA | 1.1 | 1.4 | 1.2 | 1.0 |
| State | 3.4 | NA | 2.8 | 2.6 | 2.9 | 2.5 |
| Local | 10.0 | NA | 9.5 | 7.5 | 9.0 | 8.9 |
| * Average is for CES, ACS, QCEW, and BEA.
** 2016 employment; all other employment sources are for 2017. |
||||||
| Sources: Current Employment Statistics (CES), American Community Survey (ACS), Quarterly Census of Employment and Wages (QCEW), Bureau of Economic Analysis (BEA), DEED, and Bureau of Labor Statistics (Projections) | ||||||
When compared to other states Minnesota ranks anywhere from having the 14th lowest percent of employment in government jobs, using CES data, to 7th lowest, using ACS data. In other words, workers in most other states are more likely to be on public payrolls than workers in Minnesota.
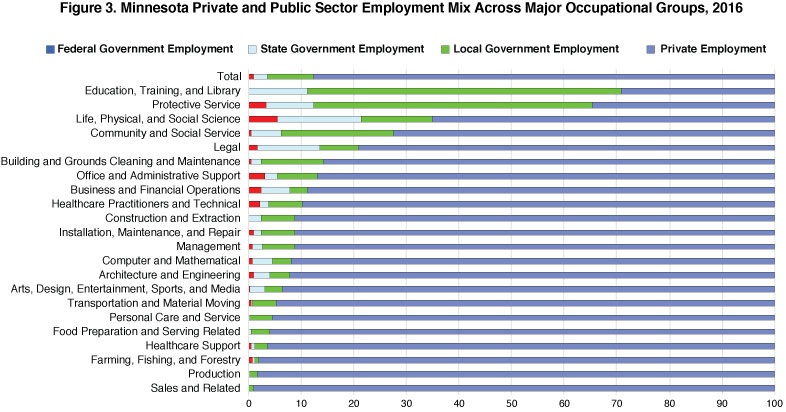
The mix of Minnesota employment in terms of private and federal, state, and local government employment is shown again in the top bar of Figure 3. The federal government employed roughly 32,000 workers in 2016 with 12,500 working at the U.S. Postal Service and the other 19,500 employees spread across various agencies. State government payrolls totaled 77,600 employees with 38,600 at the state's universities, four-year colleges, or community and technical colleges excluding work study jobs. Another 2,500 state workers were employed at state hospitals while the remaining 36,500 state employees worked at various state agencies. Local government employment totaled 277,000 spread across local school districts (146,500), local government hospitals (7,900), and all other local government (122,600). All other local government employees work mainly for townships, cities, and counties.6 The other 2.7 million jobs were in the private sector with 92.4 percent being private sector wage and salary jobs and 7.6 percent self-employed jobs.

The other bars show the private and public mix for the 22 major occupational groups. Public sector jobs are most prevalent among education, training, and library occupations with 11.1 percent of jobs in this occupational group employed by state government, 59.7 percent employed by local government (public school districts), and 29.2 percent employed in the private sector. Public sector employment is also predominant in protective service occupations (from police and sheriff's patrol officer jobs to fish and game warden jobs). If you want to work in the public sector you probably don't want to enroll in training for sales and related occupations or production occupations. The workforce of these two occupational groups have the lowest percent of employment in public sector jobs. Government entities have little to do with retail and wholesale activities or manufacturing besides collecting taxes from such activities.
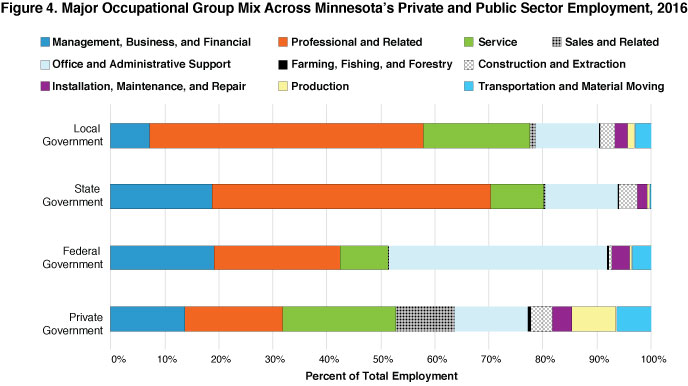
Another way to view public sector occupational employment is to look at the occupational distribution by different levels of government. Figure 4 displays this view combining the 22 major occupational groups into 10 higher-aggregated groups. Most of the aggregation involved combining smaller professional occupational groups into the professional and related occupational group. State government has the highest percent of employment involved when management, business, and financial occupations and professional and related occupations are combined. A large share of federal government employment is in office and administrative support occupations. That is from the U.S. Postal Services employment of mail carriers, sorters, processors, and processing machine operators, and clerks. Employment in these three occupations totaled nearly 10,000 or almost a third of federal government employment in the state in 2016.

Private sector employment is considerably more diverse than public sector employment when it comes to occupational mix. That makes sense since the government role in suppling goods and services is limited relative to the private sector. The share of private employment in either management, business, or financial occupations and professional and related occupations is below that in the public sector. Employment in service, sales and related, farming, construction, production, and transportation and material moving occupations is mainly found in the private sector.
The outsourcing of government supplied goods or services can influence the mix of public and private employment for some occupations. Taxpayers may still be providing the funds for certain goods and services but privately hired workers are responsible for production of the goods and services. A prime example of how blurred the mix of public and private employment can be is the transfer of the hospital staffs from public to private when the University hospital, Hennepin County hospital, and Regions hospital all transferred from public to non-profit institutions. The hospitals staffs went from public to private payrolls.
Table 2 supplies a sample of the top occupations in different government entities as well as in the private sector. General office clerks are the only occupation to show up on all Top Ten lists. That is probably a good indicator of who really keeps things humming at all places of work. Registered nurses show up on four of the lists. All other business operations specialist is a catch-all occupation for business occupations specialist not listed separately that may be in Top Ten lists more from how surveys are filled out than a reflection of actually duties carried out. Other occupations are very specific to the services that we typically think of as public goods and services such as education, law enforcement, security, highway maintenance, and social welfare programs. Public employees providing these goods and services include elementary school teachers, police officers, firefighters, transportation security screeners, highway maintenance workers, and social and human service assistants. If you want to work in these occupations you most likely will be getting your paycheck from a public entity.
| Table 2. Top 10 Occupations | |||||
|---|---|---|---|---|---|
| Top Private Sector Occupations | Total Employment | Top 10 Percent of Employment | Total Federal Government Employment (excluding U.S. Postal Service) | Total Employment | Top 10 Percent of Employment |
| - | 2,710,848 | 21.5 | - | 19,376 | 37.9 |
| Retail Salespersons | 86,434 | 3.2 | Registered Nurses | 1,591 | 8.2 |
| Personal Care Aides | 68,317 | 2.5 | Business Operations Specialists, All Other | 928 | 4.8 |
| Combined Food Preparation and Serving Workers, Including Fast Food | 63,142 | 2.3 | Claims Adjusters, Examiners, and Investigators | 915 | 4.7 |
| Cashiers | 62,093 | 2.3 | Information and Record Clerks, All Other | 698 | 3.6 |
| Registered Nurses | 57,936 | 2.1 | Transportation Security Screeners | 692 | 3.6 |
| Customer Service Representatives | 55,588 | 2.1 | Air Traffic Controllers | 595 | 3.1 |
| Farmers, Ranchers, and Other Agricultural Managers | 50,747 | 1.9 | Compliance Officers | 589 | 3.0 |
| Waiters and Waitresses | 50,474 | 1.9 | Physicians and Surgeons | 489 | 2.5 |
| Office Clerks, General | 47,233 | 1.7 | Licensed Practical and Licensed Vocational Nurses | 442 | 2.3 |
| General and Operations Managers | 41,147 | 1.5 | Office Clerks, General | 402 | 2.1 |
| Top State Government Education Only | Total Employment | Top 10 Percent of Employment | Top State Government Excluding Education | Total Employment | Top 10 Percent of Employment |
| - | 38,579 | 65.3 | - | 39,013 | 38.0 |
| Postsecondary Teachers | 16,356 | 42.4 | Business Operations Specialists, All Other | 2,987 | 7.7 |
| Education Administrators, Postsecondary | 1,714 | 4.4 | Correctional Officers and Jailers | 2,308 | 5.9 |
| Janitors and Cleaners, Except Maids and Housekeeping Cleaners | 1,335 | 3.5 | Office Clerks, General | 1,868 | 4.8 |
| Secretaries and Administrative Assistants, Except Legal, Medical, and Executive | 1,271 | 3.3 | Highway Maintenance Workers | 1,862 | 4.8 |
| Educational, Guidance, School, and Vocational Counselors | 1,045 | 2.7 | Court, Municipal, and License Clerks | 1,158 | 3.0 |
| Business Operations Specialists, All Other | 1,028 | 2.7 | Registered Nurses | 1,110 | 2.8 |
| Executive Secretaries and Executive Administrative Assistants | 659 | 1.7 | Tax Examiners and Collectors, and Revenue Agents | 950 | 2.4 |
| Teachers and Instructors, All Other, Except Substitute Teachers | 632 | 1.6 | Social and Human Service Assistants | 935 | 2.4 |
| Office Clerks, General | 601 | 1.6 | Network and Computer Systems Administrators | 830 | 2.1 |
| Instructional Coordinators | 564 | 1.5 | Management Analysts | 820 | 2.1 |
| Top Local Government Education Only | Total Employment | Top 10 Percent of Employment | Top Local Government Excluding Education | Total Employment | Top 10 Percent of Employment |
| - | 146,510 | 69.0 | - | 130,474 | 31.7 |
| Elementary School Teachers, Except Special Education | 25,317 | 17.3 | Police and Sheriff's Patrol Officers | 9,246 | 7.1 |
| Teacher Assistants | 24,551 | 16.8 | Firefighters | 6,119 | 4.7 |
| Secondary School Teachers, Except Special and Career/Technical Education | 18,579 | 12.7 | Office Clerks, General | 3,917 | 3.0 |
| Middle School Teachers, Except Special and Career/Technical Education | 9,610 | 6.6 | Highway Maintenance Workers | 3,838 | 2.9 |
| Janitors and Cleaners, Except Maids and Housekeeping Cleaners | 5,963 | 4.1 | Registered Nurses | 3,722 | 2.9 |
| Special Education Teachers, Kindergarten and Elementary School | 4,354 | 3.0 | Bus Drivers, School or Special Client | 3,328 | 2.6 |
| Office Clerks, General | 3,451 | 2.4 | Child, Family, and School Social Workers | 3,286 | 2.5 |
| Secretaries and Administrative Assistants, Except Legal, Medical, and Executive | 3,282 | 2.2 | Maintenance and Repair Workers, General | 2,807 | 2.2 |
| Special Education Teachers, Secondary School | 3,070 | 2.1 | Correctional Officers and Jailers | 2,617 | 2.0 |
| Combined Food Preparation and Serving Workers, Including Fast Food | 2,943 | 2.0 | Eligibility Interviewers, Government Programs | 2,493 | 1.9 |
| Source: 2016 staffing pattern from Employment Projections, Labor Market Information Office, Minnesota DEED. | |||||
2More information on Minnesota's OES.
3An aggregated 2016 staffing pattern matrix for Minnesota is available. More detailed staffing patterns at the national level are available.
4Industry staffing patterns are used in generating long-term employment projections. The eight government industries are: U.S. Postal Service; all other federal government excluding U.S. Postal Service; state government education; state government hospital; all other state government excluding education and hospital; local government education; local government hospital; and all other local government excluding education and hospitals.
5Differences in QCEW and CES employment data are explored.
6In both CES and QCEW data on employment at American Indian casinos are included in local government employment. This employment in projection work is moved into the private sector.