by Amanda O'Connell
February 2024
The Agriculture, Forestry, Fishing, and Hunting industry plays a crucial role in the local economy and community. Just under 11,000 farms operating in the region, according to the 2022 Census of Agriculture. In addition, there were 410 firms operated within this industry, providing 3,238 jobs in 2022, accounted for 1.3% of Southeast Minnesota's total employment in 2022. Since 2012, the sector saw a notable job increase of 362 jobs, marking 12.6% growth.
Within the broader Agriculture industry, significant employment gains were found in three subsectors: Crop Production, Animal Production and Aquaculture, and Support Activities for Agriculture, and Forestry. The largest numeric growth occurred in the Animal Production and Aquaculture subsector, which added 155 jobs over the decade. Meanwhile, the Support Activities for Agriculture and Forestry subsector experienced the largest percent increase of 28% since 2012.
Within Southeast Minnesota, the Animal Production and Aquaculture subsector held the largest share of employment, contributing 65.9% of the industry's total jobs. Crop Production had the second largest job count, representing 24.6% of the industry's jobs. The Support Activities for Agriculture and Forestry subsector, although smaller, still played a significant role, providing 297 jobs and making up 9.2% of the total employment in the Agriculture sector in the region.
Those three subsectors can be drilled down further to get even greater detail of Agriculture employment in Southeast. In Crop Production the most significant employment was in Greenhouse, Nursery, and Floriculture Production, which saw an increase of 79 jobs since 2012. The Animal Production and Aquaculture subsector's largest employment category was Cattle Ranching and Farming, accounting for 1,284 jobs, with a growth of 64 jobs during the same period. Meanwhile, the most substantial employment within the Support Activities for Agriculture and Forestry subsector was in Support Activities for Crop Production, which had 177 jobs (see Table 1).
| Table 1. Agriculture, Forestry, Fishing, and Hunting Employment in Southeast Minnesota, 2022 | ||||||
|---|---|---|---|---|---|---|
| Industry | Number
of Jobs |
Number of Establishments | Total Wages | Avg. Weekly Wage | 2012-2022 Change | |
| Numeric Change | Percent Change | |||||
| Total, All Industries | 240,167 | 13,323 | $14,687,294,781 | $61,100 | 7,020 | 3.0% |
| Agriculture, Forestry, Fishing, and Hunting | 3,238 | 410 | $136,979,935 | $42,172 | 362 | 12.6% |
| Crop Production | 796 | 122 | $37,114,138 | $46,228 | 145 | 22.3% |
| Oilseed and Grain Farming | 268 | 65 | $11,683,603 | $43,108 | 49 | 22.4% |
| Vegetable and Melon Farming | 139 | 14 | $5,912,077 | $40,040 | N/A | N/A |
| Fruit and Tree Nut Farming | 41 | 7 | $699,142 | $17,420 | N/A | N/A |
| Greenhouse, Nursery and Floriculture Production | 295 | 18 | $16,446,287 | $54,704 | 79 | 36.6% |
| Other Crop Farming | 52 | 18 | $2,373,029 | $45,604 | 2 | 4.0% |
| Animal Production and Aquaculture | 2,135 | 207 | $88,414,769 | $41,340 | 155 | 7.8% |
| Cattle Ranching and Farming | 1,284 | 130 | $45,497,009 | $35,360 | 64 | 5.2% |
| Hog and Pig Farming | 487 | 52 | $24,826,562 | $50,908 | 4 | 0.8% |
| Poultry and Egg Production | 234 | 8 | $13,318,187 | $56,888 | N/A | N/A |
| Animal Aquaculture | 16 | 2 | $1,079,360 | $66,196 | N/A | N/A |
| Support Activities for Agriculture and Forestry | 297 | 74 | $11,056,448 | $37,232 | 65 | 28.0% |
| Support Activities for Crop Production | 177 | 37 | $7,506,484 | $42,068 | 48 | 37.2% |
| Source: Quarterly Census of Employment and Wages | ||||||
In Southeast Minnesota the Agriculture sector workforce has seen an interesting demographic shift between 2012 and 2022, with a modest influx of younger workers aged 14-18 years and a substantial retention of middle-aged (35-44) and older workers (55-64 and 65 years and over), showing increases of 14.2%, 32.5%, 22.3%, and 105%. This trend highlights a broad generational engagement, from a modest number of young newcomers to a strong presence of Baby Boomers continuing in their roles. Conversely, across all industries, there's been a more pronounced growth among the youngest workers compared to the oldest, suggesting a broader integration of younger individuals and a less pronounced, yet significant, retention of older workers compared to the Agricultural sector (see Table 2).
| Table 2. Employment Change by Age in Agriculture, Forestry, Fishing, & Hunting, in Southeast Minnesota, 2012-2022 | ||||
|---|---|---|---|---|
| Age Group | 2012 | 2022 | Change | % Change |
| 14-18 years | 190 | 217 | 27 | 14.2% |
| 19-21 years | 200 | 150 | -50 | -25.0% |
| 22-24 years | 208 | 166 | -42 | -20.2% |
| 25-34 years | 749 | 668 | -81 | -10.8% |
| 35-44 years | 507 | 672 | 165 | 32.5% |
| 45-54 years | 531 | 520 | -11 | -2.1% |
| 55-64 years | 385 | 471 | 86 | 22.3% |
| 65 years & over | 222 | 455 | 233 | 105.0% |
| All Ages | 2,992 | 3,319 | 327 | 10.9% |
| Source: Quarterly Workforce Indicators | ||||
Table 3 shows the employment shifts across various age groups across all industries in Southeast Minnesota from 2012 to 2022. The data highlights a pronounced employment growth among the youngest and oldest workers, with a notable decline in the 45-54 year old age group. This trend reflects the aging of the Baby Boomer generation into the 55-64 age bracket. Agriculture's marked retention of older workers could stem from the dependence on experienced personnel frequently found in family-owned farms or businesses.
| Table 3. Employment Change by Age in All Industries, in Southeast Minnesota, 2012-2022 | ||||
|---|---|---|---|---|
| Age Group | 2012 | 2022 | Change | % Change |
| 14-18 years | 7,430 | 10,899 | 3,469 | 46.7% |
| 19-21 years | 11,665 | 12,078 | 413 | 3.5% |
| 22-24 years | 13,621 | 13,240 | -381 | -2.8% |
| 25-34 years | 50,090 | 50,254 | 164 | 0.3% |
| 35-44 years | 46,148 | 54,334 | 8,186 | 17.7% |
| 45-54 years | 55,119 | 47,590 | -7,529 | -13.7% |
| 55-64 years | 40,458 | 44,994 | 4,536 | 11.2% |
| 65 years & over | 11,516 | 17,184 | 5,668 | 49.2% |
| All Ages | 236,047 | 250,573 | 14,526 | 6.2% |
| Source: Quarterly Workforce Indicators | ||||
In addition to data from DEED's Quarterly Census of Employment and Wages, which provides job counts for firms and workers covered by the Unemployment Insurance program, the U.S. Department of Agriculture also conducts a Census of Agriculture every five years, tallying farms and ranches across the nation. Farms and ranches are included in the count if they produced or sold agricultural products valued at $1,000 or more during the census year.
In 2022 Southeast Minnesota had 10,852 farms, a decrease of 1,227 farms since 2012. Despite the declines, it's interesting to note that farms are getting bigger in most counties. From 2012 to 2022 seven1</> of the 11 counties had farms that were, on average, larger than they were in 2012. This suggests that while there are fewer farms overall, the ones that remain are taking up more land, perhaps merging with or taking over neighboring lands that were once part of smaller farms. This shift could mean farming in the area is moving towards larger operations (see Table 4).
| Table 4. Census of Agriculture, 2012-2022 | |||||||
|---|---|---|---|---|---|---|---|
| State Rank of # of Farms | County | 2022 Farms | 2022 Sales | 2012 Farms | 2012 Sales | Numeric Change in Farms, 2012-2022 | Percent Change in Farms, 2012-2022 |
| 31 | Dodge Co. | 614 | $413,313,000 | 621 | $288,129,000 | 7 | 1.1% |
| 19 | Fillmore Co. | 1,458 | $519,865,000 | 1,553 | $342,205,000 | 95 | 6.1% |
| 24 | Freeborn Co. | 908 | $475,632,000 | 1,122 | $416,020,000 | 214 | 19.1% |
| 13 | Goodhue Co. | 1,406 | $595,613,000 | 1,536 | $435,687,000 | 30 | 8.5% |
| 55 | Houston Co. | 797 | $213,008,000 | 920 | $146,256,000 | 123 | 13.4% |
| 18 | Mower Co. | 999 | $529,254,000 | 1,053 | $475,801,000 | 54 | 5.1% |
| 42 | Olmsted Co. | 1,102 | $337,134,000 | 1,150 | $250,093,000 | 48 | 4.2% |
| 39 | Rice Co. | 1,111 | $356,823,000 | 1,304 | $231,589,000 | 193 | 14.8% |
| 35 | Steele Co. | 721 | $396,997,000 | 796 | $293,053,000 | 75 | 9.4% |
| 43 | Wabasha Co. | 743 | $329,119,000 | 909 | $231,196,000 | 166 | 18.3% |
| 33 | Winona Co. | 993 | $401,862,000 | 1,115 | $282,027,000 | 122 | 10.9% |
| 3* | Southeast | 10,852 | $4,568,620,000 | 12,079 | $3,392,056,000 | 1,227 | 10.2% |
| Source: Census of Agriculture, 2012 & 2022 | |||||||
| *Rank of the six planning regions in Minnesota | |||||||
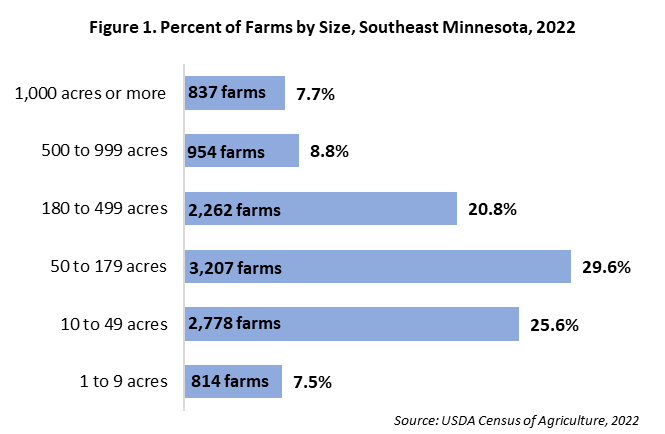
In Southeast Minnesota farms spanning 50 to 179 acres represent 29.6% of the total farms, with Fillmore County leading in this category with 507 farms. Farms ranging from 10 to 49 acres account for one-fourth of the region's farms. Goodhue County stands out in this group with 383 farms, the highest in the 11-county area. Farms between 180 to 499 acres comprise 20.8% of the region's agricultural landscape, with Winona County topping the list for this size bracket. Fillmore County is notable for having the largest number of farms within the 500 to 999 acre range, which comprises 8.8% of farms in Southeast Minnesota. The region is home to around 840 farms exceeding 1,000 acres, with Mower County having the highest number in this category, totaling 114 farms. Additionally, farms occupying one to nine acres of land make up 7.5% of the area's total, with Rice County hosting the most farms of this minimal acreage, numbering 102 farms.

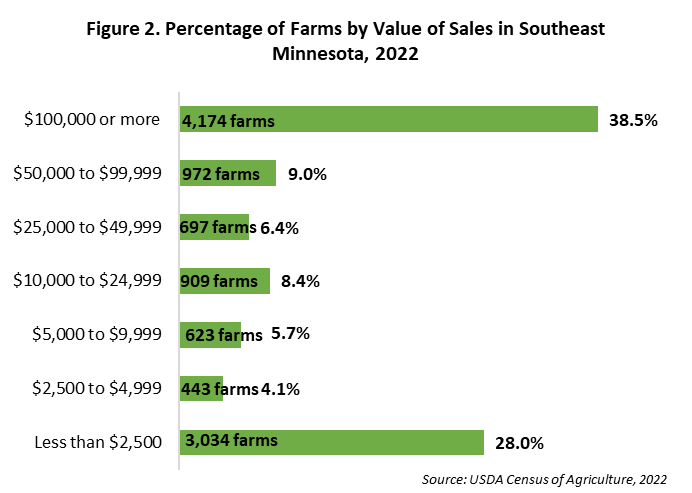
In Southeast Minnesota most farms fall into the lowest or highest sales categories. Two-thirds of farms make under $2,500 or over $100,000 in sales. Fillmore County is notable for its 402 small-scale farms earning less than $2,500, indicating a dominance of smaller agricultural operations. In contrast, Goodhue County is home to the most large-scale farms, with 584 making over $100,000, suggesting a trend toward more extensive and potentially more profitable farming practices.
Goodhue County also leads in the mid-range sales categories, reflecting a well-rounded agricultural economy with farms of varying sizes. For instance, it has the highest number of farms in the $5,000 to $9,999, $10,000 to $24,999, and $50,000 to $99,999 sales brackets. Meanwhile, Fillmore County has the most farms in the $25,000 to $49,999 range. The variety of values in sales suggests a diverse approach to farming, from part-time or niche markets to extensive crop or livestock production, underlining the vital role that both small and large farms play in the local economy.

The Agriculture industry in Southeast Minnesota has undergone significant changes between 2012 and 2022, reflecting a dynamic and evolving industry. Despite a decrease in the number of farms, the average size has increased in most counties, indicating a shift towards larger-scale farming. This transition, coupled with the demographic shifts in the agricultural workforce, underlines the industry's adaptability. The industry's growth in employment and the diverse range of farm sizes and sales categories highlight the critical role agriculture continues to play in the region's economy and community.
1Dodge, Fillmore, Olmsted, Rice, Steele, Wabasha, and Winona