by Mark Schultz
March 2020
While recent events surrounding the Coronavirus have put a halt to many activities in leisure and hospitality, eventually Minnesota residents will be able to get out and enjoy all of the wonders that Minnesota offers, including, but not limited to, museums, historical sites, and similar institutions. Most recent figures (2019) show that the state has 242 museums, historical sites, and similar institutions, such as history centers at the state, county, and community level, and various other things such as historical homes and exhibits, zoos and botanical gardens, and nature parks.
Museums, Historical Sites, and Similar Institutions make up 7.6 percent of employment in the Arts, Entertainment, and Recreation industry with over 4,000 jobs at 242 establishments. Included under this industry sector are museums (2,419 jobs at 158 firms), nature parks and other similar institutions (847 jobs at 40 establishments), zoos and botanical gardens (515 jobs at 13 firms), and historical sites (265 jobs at 31 establishments) (see Table 1).
| Industry Title | Average Jobs | Average Establishments | Total Payroll | Average Annual Wage |
|---|---|---|---|---|
| Total, All Industries | 2,900,290 | 178,242 | $172,936,995,226 | $59,644 |
| Arts, Entertainment, and Recreation | 53,533 | 3,405 | $1,963,979,858 | $36,816 |
| Museums, Historical Sites, and Similar Institution | 4,047 | 242 | $146,647,461 | $36,348 |
| Museums | 2,419 | 158 | $90,278,377 | $37,336 |
| Historical Sites | 265 | 31 | $5,771,417 | $21,736 |
| Zoos and Botanical Gardens | 515 | 13 | $18,773,307 | $36,556 |
| Nature Parks and Other Similar Institutions | 847 | 40 | $31,824,360 | $38,792 |
| Source: DEED Quarterly Census of Employment and Wages | ||||
Also shown in Table 1, annual wage figures for this industry rest at $36,348 and are 39.1 percent lower than wages across all industries. This is likely because more jobs in the Museums, Historical Sites, and Similar Institutions industry are part-time jobs. Overall, the average annual wages for this sub-sector increased by 16.1 percent over the last 10 years, resulting in a hike of $5,044.
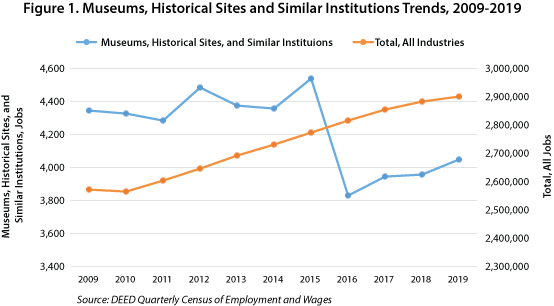
While the total of all jobs across all industries enjoyed a gain over the last decade, the Museums, Historical Sites, and Similar Institution industry saw a decline. Overall, from 2009 to 2019 the Museums, Historical Sites, and Similar Institution industry lost 6.8 percent of its jobs, a loss of 297 jobs (see Figure 1).

National security and international affairs (NAICS 928) is a sub-sector of the Public Administration industry in the state of Minnesota. While it makes up a minimal percent of the total employment in public administration (1.8 percent) it still serves an important role in safeguarding Minnesota's residents. The majority of the jobs for the national security and international affairs sector are found in national security, with 2,250 jobs at 42 establishments, compared to only 212 jobs at four international affairs firms (see Table 1).
| Industry Title | Average Employment | Average Establishments | Total Payroll | Average Annual Wage |
|---|---|---|---|---|
| Total, All Industries | 2,900,290 | 178,242 | $172,936,995,226 | $59,644 |
| Public Administration | 135,897 | 3,284 | $8,111,089,389 | $59,696 |
| National Security and International Affairs | 2,462 | 46 | $167,099,644 | $67,860 |
| National Security | 2,250 | 42 | $148,737,569 | $66,092 |
| International Affairs | 212 | 4 | $18,362,075 | $86,372 |
| Source: DEED Quarterly Census of Employment and Wages | ||||
As shown in Table 1, average annual wages in the National Security and International Affairs industry were 13.8 percent higher than the wages across all industries. The highest paying sub-sector was international affairs with a median annual wage of over $86,000, while the wages for national security rested at just over $66,000. Over the last decade, the wages for the National Security and the International Affairs industry grew by 12.1 percent, equaling an increase of $7,332.
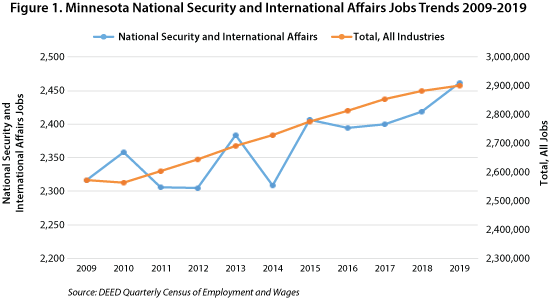
Both the total of all jobs across all industries and the National Security and International Affairs industry saw overall gains over the last decade. While all industries saw a consistent year-after-year increase, the trend for National Security and International Affairs was characterized by a series of ups and downs. Despite the ups and downs, the National Security and International Affairs industry saw an overall increase of 6.3 percent, equaling 145 more jobs in 2019 than were seen in 2009 (see Figure 1).

According to the Bureau of Labor Statistics, nonmetallic mineral product manufacturing includes the process of transforming mined materials into products for use. These materials include sand, gravel, stone, clay, and refractory materials, materials that are resistant to high temperatures.
Nonmetallic mineral product manufacturing makes up 3.2 percent of the total employment in manufacturing in Minnesota, with over 10,400 jobs at 344 establishments. Included under nonmetallic mineral product manufacturing are glass and glass product manufacturing (2,981 jobs at 32 establishments), cement and concrete product manufacturing (3,907 jobs at 228 firms), and other nonmetallic mineral product manufacturing, such as abrasive products, cut stone, and mineral wool manufacturing (2,939 jobs at 66 establishments) (see Table 1).
| Industry Title | Average Employment | Average Establishments | Total Payroll | Average Annual Wage |
|---|---|---|---|---|
| Total, All Industries | 2,900,290 | 178,242 | $172,936,995,226 | $59,644 |
| Manufacturing | 323,918 | 8,269 | $22,052,647,388 | $68,068 |
| Nonmetallic Mineral Product Manufacturing | 10,403 | 344 | $651,271,279 | $62,556 |
| Glass and Glass Product Manufacturing | 2,981 | 32 | $190,348,239 | $63,856 |
| Cement and Concrete Product Manufacturing | 3,907 | 228 | $247,864,710 | $63,076 |
| Other Nonmetallic Mineral Product Manufacturing | 2,939 | 66 | $177,253,642 | $60,268 |
| Source: DEED Quarterly Census of Employment and Wages | ||||
Also shown in Table 1, median annual wages for nonmetallic mineral product manufacturing sit at $62,556, which is $2,912 (4.9 percent) higher than the average annual wages across all industries. The highest paying sub-sector was glass and glass product manufacturing with an annual average wage of $63,856, which is over $4,200, or 7.1 percent, higher than wages across all industries. Over the last decade, the wages for nonmetallic mineral product manufacturing grew by 31.5 percent, equaling an increase of almost $15,000.
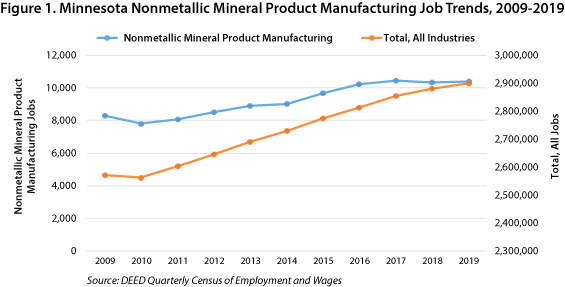
Both the total jobs across all industries and the nonmetallic mineral product manufacturing industry saw job gains during the last decade. Over this time frame, the number of jobs in nonmetallic mineral product manufacturing grew by 25.8 percent, which equaled an additional 2,133 jobs in this industry (see Figure 1).

According to the Bureau of Labor Statistics, nonstore retailers include establishments such as "mail order houses, vending machine operators, home delivery sales, door-to-door sales, party plan sales, electronic shopping, and sales through portable stalls (e.g. street vendors, except food)." Nonstore retailers are a subsector of the Retail Trade industry.
Nonstore retailers make up 4 percent of the total employment in retail trade, equaling almost 11,800 jobs at 1,217 establishments. The bulk of these jobs are in electronic shopping and mail order houses, which make up 67.7 percent of the nonstore retailer jobs, equaling 7,980 jobs at 471 firms. There are two additional segments to nonstore retailers: direct selling establishments (3,157 jobs at 686 establishments) and vending machine operators (654 jobs at 60 firms) (see Table 1).
| Industry Title | Average Employment | Average Establishments | Total Payroll | Average Annual Wage |
|---|---|---|---|---|
| Total, All Industries | 2,900,290 | 178,242 | $172,936,995,226 | $59,644 |
| Retail Trade | 293,283 | 18,261 | $9,223,624,145 | $31,408 |
| Nonstore Retailers | 11,792 | 1,217 | $746,459,548 | $63,284 |
| Electronic Shopping and Mail Order Houses | 7,980 | 471 | $552,841,599 | $69,264 |
| Vending Machine Operators | 654 | 60 | $33,570,009 | $51,220 |
| Direct Selling Establishments | 3,157 | 686 | $160,047,940 | $50,648 |
| Source: DEED Quarterly Census of Employment and Wages | ||||
Also shown in Table 1, the average annual wage for nonstore retailers was over double that seen in the broader retail trade sector, with average annual wages of $63,284 compared to the $31,408 seen in retail trade. The highest average annual wages were $69,264 in electronic shopping and mail order houses, while the remaining two segments – vending machine operators and direct selling establishments – saw lower wages ($51,220 and $50,648, respectively). Over the last decade, wages for nonstore retailers increased by almost 45.9 percent or $19,916.
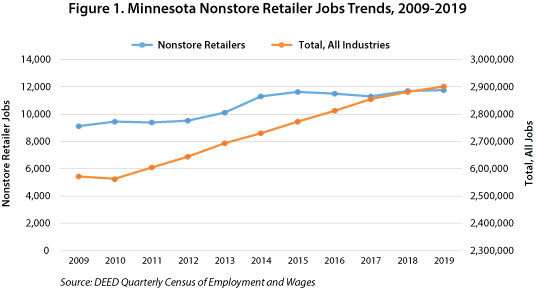
Both the total jobs across all industries and nonstore retailer jobs saw increases over the last 10 years. Nonstore retailer jobs increased by 29.3 percent from 2009 to 2019, an increase of 2,670 jobs. The current (2019) estimated number of jobs (11,792) is the highest this industry has seen over the last 10 years.
