by Nick Dobbins
May 2018
Employment in the Minneapolis-St. Paul MSA was up by 18,708 (0.9 percent) in April. While sizeable, this actually marked the lowest proportional April employment increase in the metro since 2013. As would be expected in the spring, Mining, Logging, and Construction employment was up by 6.8 percent (4,727 jobs), although this is also a smaller proportional increase than we have seen in recent Aprils, perhaps caused by our late snowfalls this year. Only three supersectors contracted on the month (Government, Information, and Trade, Transportation, and Utilities), and they combined to lose just 841 total jobs. Over the year the metro area added 13,676 jobs (0.7 percent). Mining, Logging, and Construction had the largest proportional decline, off by 3.2 percent (2,471 jobs) from April of 2017 from smaller-than-usual spring employment growth this year. Professional and Business Services lost 3,598 jobs (1.1 percent), with declines in all three major component sectors. The largest real and proportional job increase came from Government employers, which added 6,031 jobs (2.4 percent), with all of that coming at the state and local level (up 2,993 or 4.5 percent and 3,062 or 1.9 percent, respectively), as federal employers shed 24 jobs, 0.1 percent. Educational and Health Services added 5,530 jobs (1.7 percent), with 3,644 additional jobs in Health Care and Social Assistance and 1,886 in Educational Services.
The Duluth-Superior MSA added 684 jobs (0.5 percent) in April. This was the lowest April over-the-month growth in the MSA since 2009. Increases were driven by Mining, Logging, and Construction (up 279 or 3.3 percent), Leisure and Hospitality (up 514, 3.8 percent), and Professional and Business Services (up 179, 2.3 percent). The largest over-the-month decline came in Educational and Health Services, which was off by 288 jobs (0.9 percent). Annually the Duluth MSA added 607 jobs (0.4 percent), a notable decrease from March’s 1.2 percent over-the-year growth. Government employers added 577 jobs (2.1 percent), Manufacturers added 238 (3.3 percent), and Mining, Logging, and Construction added 262 (3.1 percent). The largest real loss came in Professional and Business Services (off by 3 percent or 245 jobs) while the biggest proportional decline came in the small Information supersector, which was down 5.5 percent from April of 2017 or 76 total jobs.
The Rochester MSA added 190 jobs (0.2 percent) in April. This was noticeably behind the statewide over-the-month growth of 0.8 percent, perhaps owing to a decline of 554 jobs (1.1 percent) in regional stalwart Educational and Health Services. Mining, Logging, and Construction saw the most growth in the region, adding 358 jobs (9.4 percent). Leisure and Hospitality employment was up by 255 (2.4 percent). Annually Rochester lost 704 jobs (0.6 percent). It was the only MSA primarily in Minnesota to lose jobs on an over-the-year basis (both of the MSAs we share with North Dakota lost jobs as well). Mining, Logging, and Construction had the largest proportional decline, off by 4.9 percent (216 jobs), while Educational and Health Services lost the most jobs, down 1,391 (2.8 percent).
Employment in the Saint Cloud MSA was up by 1,084 (1 percent) in April. It was the largest proportional over-the-month growth of any MSA in the state. The only supersector to lose jobs on the month was, surprisingly, Leisure and Hospitality, which was off by 111 (1.3 percent). This was the only MSA primarily in Minnesota in which Leisure and Hospitality employment declined in April. The largest growth in the MSA came in Mining, Logging, and Construction which added 418 jobs (7.2 percent). Annually the Saint Cloud MSA added 462 jobs (0.4 percent). The Manufacturing supersector employers added 576 jobs (3.8 percent), and Educational and Health Services added 719 (3.3 percent). The largest decline came in Leisure and Hospitality, which was off by 881 jobs or 9.5 percent.
The Mankato-North Mankato MSA added 263 jobs (0.4 percent) in April. The gains all came in the private sector (up 295, 0.6 percent) as public sector employment was off by 32 (0.3 percent). Goods producers added 216 jobs (2.2 percent), and service providers added 47 (0.1 percent). Annually the MSA added 901 jobs (1.6 percent). This was the largest proportional over-the-year growth in the state. Most of the growth came from the private sector, which added 880 jobs (1.8 percent) to the government’s 21 jobs (0.2 percent).
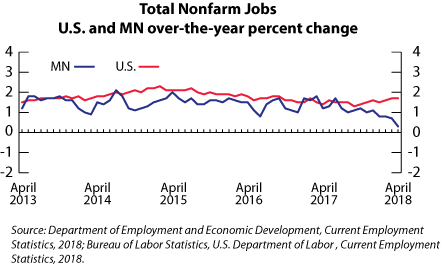
Employment in the Fargo-Moorhead MSA was up in April as the area added 785 jobs (0.6 percent). Mining, Logging, and Construction was the biggest driver of that growth, by a large margin, as the supersector added 605 jobs (7.9 percent). The next most notable gain came in Educational and Health Services, up 176 (0.7 percent). Annually the area lost 900 jobs (0.6 percent), in contrast to Minnesota’s statewide over-the-year growth of 0.4 percent. Leisure and Hospitality employment was off by 775 (5.5 percent), and Professional and Business Services was down by 681 (4.3 percent).
The Grand Forks-East Grand Forks MSA added 178 jobs (0.3 percent) in April. As was the case in Fargo-Moorhead, the growth was led by Mining, Logging, and Construction employment (up 192 or 7.8 percent), with an assist from Trade, Transportation, and Utilities (up 150, 1.3 percent). Leisure and Hospitality employment dropped the farthest, both in total jobs and in proportional decline, off by 102 (1.9 percent). Annually the MSA lost 367 jobs (0.7 percent). Growth was strong in Manufacturing (up 279, 6.6 percent) and Professional and Business Services (up 219, 7.1 percent). However, those gains were more than erased by losses in other areas, including Government employment (down 353, 2.4 percent) and Leisure and Hospitality (down 650, 10.8 percent).
