by Cameron Macht
September 2021
Minnesota is perhaps best known for having 10,000 lakes, but the state is also home to 87 counties, 16 workforce development areas, 13 economic development regions, six planning regions, and five metropolitan statistical areas. While some geographies have many similarities such as farmland or four-year universities, others are as different as the terrain they're built on and the people and industries they've raised. Each area has their own unique characteristics. Economic and workforce development professionals can use each area's demographic, social, labor force, and industry employment information to better understand how to maximize opportunities for their area of interest.
DEED's Regional Analysis and Outreach unit produces a set of regional and county profiles each year to help facilitate more familiarity with the different aspects of each area. Each profile report explores and explains population trends, labor force changes, unemployment rates, occupations and wages, incomes and cost of living, and industry employment statistics.
After growing 7.6% over the decade, Minnesota's population surpassed 5.7 million people according to the 2020 Census. That slightly exceeded the national growth rate and easily outpaced most other Midwestern states. But the population gains were not shared equally across the state. Four of the six planning regions, eight of the 13 economic development regions, and 45 of the 87 counties in the state added people over the past decade.
Seven counties grew more than 10% since 2010, with the fastest growth occurring in the state's metro areas including the Twin Cities, Rochester, and St. Cloud. As a region, the Twin Cities expanded fastest and in the largest numbers, followed by rapid gains in Central and steady growth in Southeast and Northwest. In contrast, all of the fastest drops were seen in small, rural counties, most of which have been losing population for several decades. Both Northeast and Southwest saw declines at the regional level as their populations continue to age.
In fact, Northeast was the only region to record more deaths than births over the decade – the other five regions still had a positive natural rate of increase. The state had more than 250,000 more births than deaths since 2010, accounting for nearly three-fourths of the population growth. The remaining increase came as the state welcomed net in-migration from foreign-born residents. All six regions enjoyed a rise in immigrants, which became even more important when set against the backdrop of domestic out-migration in most regions and the state as a whole – meaning that more Minnesotans moved to other states than residents from other states moved to Minnesota during the decade.
Despite a slowdown in the past few years, Minnesota's immigrant population jumped nearly 30% from 2010 to 2019, with foreign-born residents now accounting for 8.5% of the total state population, but as little as 2.3% in both Northeast and Northwest, and as much as 12.1% in the Twin Cities. The largest number of foreign-born residents in the state were born in Asia, but the fastest wave of new immigrants has come from Africa. Minnesota is also home to many immigrants from across the borders in Latin America and Canada.
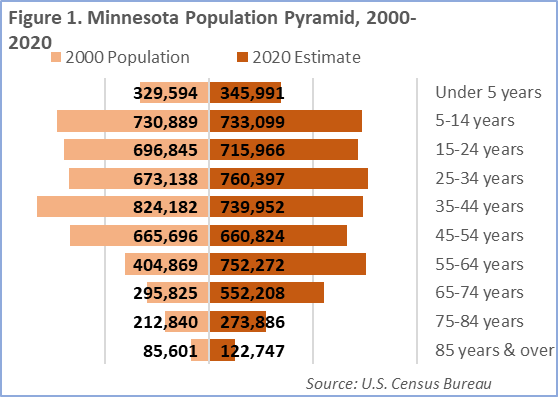
With a median age of 56.8 years and more than one-third of residents aged 65 years and older, Aitkin County has the oldest population in the state, followed closely by other Northeast counties including Cook, Lake, and Koochiching. More than one in every five residents in both Northeast and Northwest were 65 years or older, with Southwest just under 20%. That represents a significant shift in age as the Baby Boom generation moves through the population pyramid (see Figure 1).
 In contrast, the youngest populations are in Scott, Sherburne, Carver, and Wright County, as well as every county that has a four-year university. The five counties with the youngest median ages in the state are Blue Earth (Mankato), Stevens (Morris), Clay (Moorhead), Beltrami (Bemidji), and Stearns (St. Cloud), and Blue Earth, Winona, and Stevens county all had more than 22% of their population between 15 and 24 years of age. But from there, the Twin Cities have attracted a much larger percentage of young adults from 25 to 44 years of age.
Every region's population has become more racially diverse over time, with several race groups doubling since the turn of the century. Minnesota's white population grew about 5% from 2000 to 2019, and still accounts for about 83% of the total population, while the number of Black or African American residents doubled and now accounts for 6.4% of the state's population, including nearly 10% in the Twin Cities.
Residents of Hispanic or Latino origin also increased more than 100% over the past two decades, and now represent more than 1 in every 20 residents statewide. Southwest has the highest concentration of Hispanic or Latino residents, at 7%. After increasing nearly 90%, Asian or Pacific Islanders make up 5% of the state's population, and 7.5% in the Twin Cities, but were growing fastest in Central.
The state also had twice as many people of two or more races in 2019 compared to 2000, and about 60% more people who identified as "some other race". Combined, those two groups accounted for 5% of the state's population, with more than two-thirds living in the Twin Cities metro area. Northwest and Northeast Minnesota have the largest shares of American Indians, with 4.1% and 2.6% of the total population, respectively. The state's American Indian population rose 5.5% since 2000.
As noted, the most racially diverse counties are in the Twin Cities metro area, but there are pockets of diversity in Greater Minnesota as well, including in Mahnomen, Beltrami, and Nobles County. In fact, Mahnomen is the only county in the state where whites account for less than 50% of the population, but Ramsey and Hennepin counties have the most non-white residents.
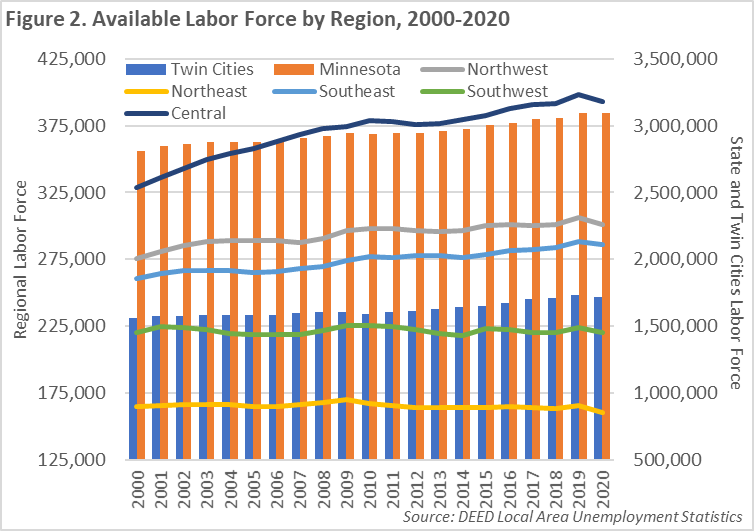
The pandemic recession wreaked havoc on the state's labor market. Over 100,000 workers dropped out of the labor force over the course of 2020 and into 2021, and for a variety of reasons including the fear of COVID, childcare needs, retirements, and more. Many of these workers have been slow to return through 2021, creating tight labor market conditions across the state.
On an annual basis, the Twin Cities lost more than 16,000 workers from 2019 to 2020, while Northwest, Central, and Northeast all lost between 5,250 and 5,500 workers. Southwest saw the biggest percentage decline after dropping nearly 4,000 workers, and Southeast was down just over 2,100 workers year over year. For several regions, that was the first decline after years of steady growth. For Northeast and Southwest, it was part of a longer-term trend.

Looking forward, every region outside the Twin Cities metro area was projected to see a labor force decline over the next 10 years, based on population projections from the Minnesota State Demographic Center and current labor force participation rates by age group. However, the projections were done before the pandemic and participation rates are down significantly in the short-term and may stay that way for the state's oldest workers. A loss of older workers would lead to even bigger declines in the labor force and increase the scarcity of workers that employers were already struggling with prior to the pandemic.
After sneaking to about 2.5 last summer as the number of unemployed workers surged and job openings stalled, the jobseeker-per-vacancy ratio in the state fell back to 1.1-to-1 in the fourth quarter of 2020 as pre-pandemic vacancy levels resumed, and the number of unemployed workers dropped along with the labor force. Southwest was the first region to fall back below a 1-to-1 ratio and now hosts the tightest labor market in the state, with employers reporting extreme difficulty in finding available workers.
Every region suffers unemployment rate disparities for Black, Indigenous, and People of Color (BIPOC) workers. In general, before the recession and even more so during the pandemic, unemployment rates are highest for workers of color, youth, people with lower educational attainment, and workers with disabilities. All of these demographic groups also displayed lower labor force participation rates, which were exacerbated during the pandemic. However, that also means there is considerable opportunity for employers to tap into these groups with available jobs.
These racial, social, and economic disparities exist and persist for a wide variety of reasons and the challenges and opportunities each region will face over the next 10 years are great. Employers cannot grow if they cannot find the talent they need. DEED is focused on helping to achieve economic success for all workers in the state by encouraging employers to use an equitable and multi-pronged approach to attracting, retaining, and training workers of all demographic characteristics.
The median household income in the state surpassed $70,000 in 2019, though incomes also varied widely by race, age, and educational attainment. In comparison, the basic needs cost of living for a typical Minnesota family, which includes 2 adults and 1 child, was $58,800 in 2020. Costs vary by family size, work status, living arrangements, and other expenses that aren't included in a basic needs budget, such as student loans, entertainment and travel, or savings.
For a single person with no children, the basic needs cost of living would require an hourly wage as low as $13.63 in Southwest Minnesota or as high as $16.84 in the Twin Cities metro area. In both cases, those wage requirements are below the median hourly wage for the total of all occupations in those regions, at $19.34 and $24.93 per hour, respectively. However, the median means that 50% of jobs pay less and 50% pay more. For workers in lower paying occupations such as food preparation and serving related, personal care and service, and healthcare support occupations, wages are often not enough to cover even a basic needs cost of living for a single person, let alone someone with children.
| Planning Region | Median Hourly Wage | Estimated Regional Employment |
|---|---|---|
| Central Minnesota | $20.66 | 283,560 |
| Northeast Minnesota | $20.49 | 132,720 |
| Northwest Minnesota | $19.24 | 207,970 |
| Southeast Minnesota | $21.13 | 231,950 |
| Southwest Minnesota | $19.34 | 166,690 |
| Twin Cities Metro Area | $24.93 | 1,697,060 |
| State of Minnesota | $23.00 | 2,708,760 |
And wage gaps between regions in Greater Minnesota versus the Twin Cities in the higher paying occupations such as management, computer and mathematical, architecture and engineering, and business and financial operations often add up to $10,000 or more per year. Employers in rural areas that are finding it difficult to attract workers may want to increase wages to be more competitive with metro areas if they want to find and keep the talent they need.
Workforce development partners can also help fill the talent pipeline by focusing on Occupations in Demand in their region. Training and education requirements of these occupations range from short-term on-the-job training to postsecondary education and advanced degrees. Most occupations in demand require a high school diploma or less to get started, while less than one-third require a bachelor's degree or higher. While occupations in demand exist in every sector, each region's major industries are well represented. In Northeast and Southeast, many of the current job openings are concentrated in areas like Health Care, while in Southwest and Northwest, Manufacturing has a high level of need for workers. Every region also sees strong demand in industries like Retail Trade, Construction, and the recovering Leisure & Hospitality sector.
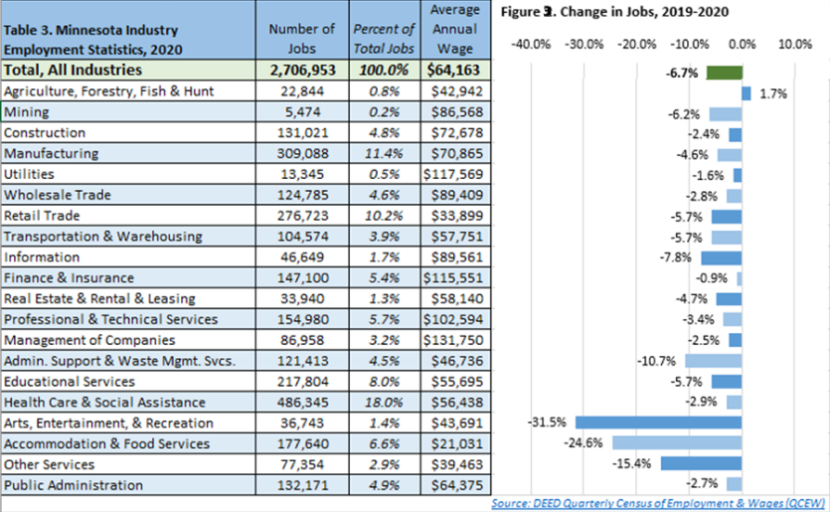
Due to the pandemic recession, the state and every region lost jobs from 2019 to 2020. Northeast and the Twin Cities were hit hardest, with job cuts surpassing -7.4%, while the other four regions all declined about -5.5% over the year. Of 87 counties, only two – Cottonwood and Rock – did not lose jobs from 2019 to 2020.
The fastest losses piled up in counties with a high concentration of employment in Leisure & Hospitality and more seasonal economies such as Mahnomen, Cook, Pine, Lake, and Mille Lacs; but the largest losses were concentrated in metro areas including the Twin Cities, Duluth, Mankato, and St. Cloud. What's more, 66 of 87 counties reported negative employment changes over the past five years as last year's decline erased all the job growth experienced in many counties during the prior four years.
Over the year, the biggest losses were seen in Arts, Entertainment & Recreation, Accommodation & Food Services, and Other Services, but several regions also saw unprecedented job declines in Administrative Support & Waste Management Services, Information, and Transportation & Warehousing. The pandemic recession also featured uncharacteristic job cuts in Health Care & Social Assistance, which had grown throughout both past two recessions in the state, and Educational Services.
In contrast, several industries emerged in relatively better shape, including Finance & Insurance, Construction, Agriculture, Management of Companies, and perhaps surprisingly, Retail Trade. (Table 3 and Figure 3). Long-term, the state is still expected to add jobs in the future. Projections that were completed before the pandemic suggested that Minnesota would add about 150,000 jobs over the next decade, but the outlook will likely change with the next version of projections released next year.

In sum, each regional and county profile helps provide the data and insights needed to better understand the most important demographic, social, labor force and industry trends that play into our state's economic health. For more information. These regional pages are regularly updated and expanded to help stakeholders react and respond to economic changes in their local area.
In addition to the regional and county profiles, the regional labor market pages include: