View: Home | Data Tool | About | Findings | Methodology | LMI Help
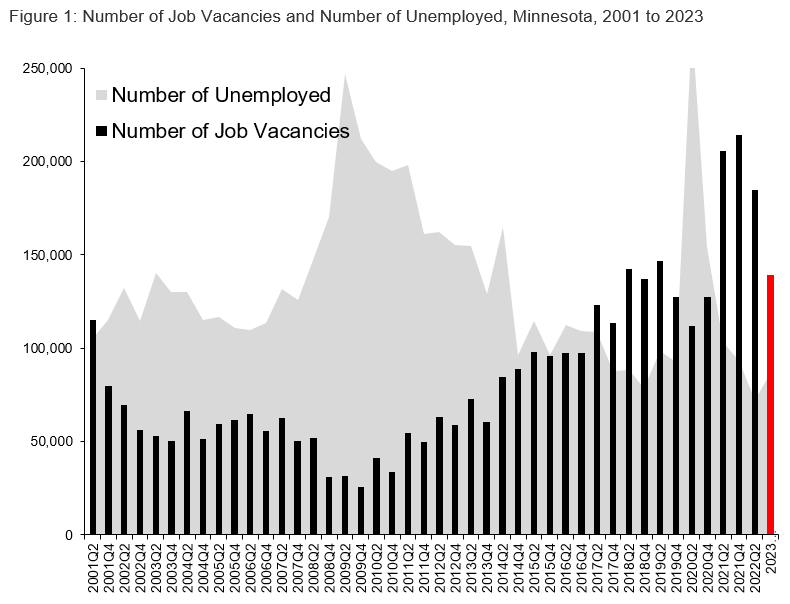
During 2023, employers reported a total of 139,059 vacancies, down 24.7% from second quarter 2022 (see Figure 1). This is the fifth highest number of vacancies on record in Minnesota dating back to 2001. However, it is well down from the previous two years, 2021 and 2022, when the labor markets in Minnesota and the nation were bouncing back from the Pandemic Recession.

This 2023 release round rolls out a new methodology for the survey that divides the sample and data collection across two rounds, second and fourth quarters of the year. The advantages of this methodology are that the time series going back to 2001 is maintained while the annual sample size, and thus the annual data collection and processing effort, is shrunk in half. However, since we were unable to run a survey during fourth quarter 2022 due to lack of funding, this analysis will compare 2023 data to second quarter 2022 data.
Compared to second quarter 2022, the number of vacancies declined and the number of unemployed individuals increased slightly in 2023. With 87,000 unemployed workers statewide in 2023, there were 0.6 unemployed persons for each vacancy, meaning that there were close to twice as many open positions as unemployed individuals in Minnesota. This is up from 2021 (0.5 workers for every one vacancy) and 2022 (0.4 works for every one vacancy), but just below 2019 (0.7 works for every vacancy) prior to the Pandemic Recession. The current rate suggests that the labor market remained tight in 2023.
These 139,059 total vacancies translate into a job vacancy rate of 5.1%, or 5.1 job openings for every 100 filled jobs in the state. This rate is down from 6.9% during second quarter 2022 (see Table 1).
| - | Number of
Job Vacancies |
Number of
Vacancies per 100 Jobs |
Number of
Unemployed Workers |
Number of
Unemployed per Vacancy |
|---|---|---|---|---|
| 2023 Year | 139,059 | 5.1% | 87,215 | 0.6 |
| 2nd Quarter 2022 | 184,588 | 6.9% | 72,526 | 0.4 |
| 4th Quarter 2021 | 214,071 | 8.2% | 92,924 | 0.4 |
| 2nd Quarter 2021 | 205,714 | 8.0% | 123,617 | 0.6 |
| 4th Quarter 2020 | 127,314 | 4.5% | 139,978 | 1.1 |
| 2nd Quarter 2020 | 111,753 | 4.0% | 299,579 | 2.7 |
| 4th Quarter 2019 | 127,550 | 4.6% | 92,692 | 0.7 |
| 2nd Quarter 2019 | 146,513 | 5.3% | 93,037 | 0.6 |
| 4th Quarter 2018 | 136,917 | 4.9% | 78,905 | 0.6 |
| 2nd Quarter 2018 | 142,282 | 5.2% | 88,517 | 0.6 |
| 4th Quarter 2017 | 113,774 | 4.2% | 87,578 | 0.8 |
| 2nd Quarter 2017 | 122,929 | 4.5% | 108,623 | 0.9 |
| 4th Quarter 2016 | 97,374 | 3.6% | 109,090 | 1.1 |
| 2nd Quarter 2016 | 97,580 | 3.6% | 112,725 | 1.2 |
| 4th Quarter 2015 | 96,114 | 3.6% | 96,263 | 1.0 |
| 2nd Quarter 2015 | 97,997 | 3.7% | 114,619 | 1.2 |
| 4th Quarter 2014 | 88,927 | 3.4% | 96,358 | 1.1 |
| 2nd Quarter 2014 | 84,696 | 3.3% | 165,184 | 2.0 |
| 4th Quarter 2013 | 60,397 | 2.3% | 129,253 | 2.1 |
| 2nd Quarter 2013 | 72,569 | 2.8% | 154,701 | 2.1 |
| 4th Quarter 2012 | 58,864 | 2.3% | 155,506 | 2.6 |
| 2nd Quarter 2012 | 62,949 | 2.5% | 162,050 | 2.6 |
| 4th Quarter 2011 | 49,890 | 2.0% | 161,292 | 3.2 |
| 2nd Quarter 2011 | 54,670 | 2.2% | 198,202 | 3.6 |
| 4th Quarter 2010 | 33,804 | 1.4% | 194,897 | 5.8 |
| 2nd Quarter 2010 | 41,397 | 1.6% | 200,037 | 4.8 |
| 4th Quarter 2009 | 25,885 | 1.0% | 212,282 | 8.2 |
| 2nd Quarter 2009 | 31,358 | 1.2% | 246,687 | 7.9 |
| 4th Quarter 2008 | 31,066 | 1.2% | 170,252 | 5.5 |
| 2nd Quarter 2008 | 51,722 | 2.0% | 147,511 | 2.9 |
| 4th Quarter 2007 | 50,594 | 1.9% | 125,999 | 2.5 |
| 2nd Quarter 2007 | 62,569 | 2.4% | 131,891 | 2.1 |
| 4th Quarter 2006 | 55,736 | 2.1% | 113,744 | 2.0 |
| 2nd Quarter 2006 | 64,958 | 2.5% | 109,667 | 1.7 |
| 4th Quarter 2005 | 61,554 | 2.4% | 110,911 | 1.8 |
| 2nd Quarter 2005 | 59,513 | 2.3% | 116,510 | 2.0 |
| 4th Quarter 2004 | 51,137 | 2.0% | 115,407 | 2.3 |
| 2nd Quarter 2004 | 66,543 | 2.6% | 130,301 | 2.0 |
| 4th Quarter 2003 | 50,439 | 2.0% | 130,390 | 2.6 |
| 2nd Quarter 2003 | 53,246 | 2.1% | 140,103 | 2.6 |
| 4th Quarter 2002 | 56,166 | 2.2% | 114,581 | 2.0 |
| 2nd Quarter 2002 | 69,715 | 2.8% | 132,274 | 1.9 |
| 4th Quarter 2001 | 79,793 | 3.1% | 115,216 | 1.4 |
| 2nd Quarter 2001 | 115,072 | 4.5% | 105,326 | 0.9 |
Regionally, 78,325 or 56.3% of all job vacancies were located in the seven-county Twin Cities metro area, while the remaining 60,734 vacancies, or 43.7%, were located in Greater Minnesota in 2023. Compared to one year ago, the number of job vacancies decreased by 20.3% in the Twin Cities and 29.6% in Greater Minnesota.
As in past years, the job vacancy rate was higher in Greater Minnesota (5.8%) than in the Twin Cities (4.6%), with both regions exhibiting tight labor markets. The Twin Cities had a ratio of 0.6 unemployed persons to every one job vacancy, while Greater Minnesota had a slightly higher ratio at 0.7 unemployed persons to every one job vacancy.
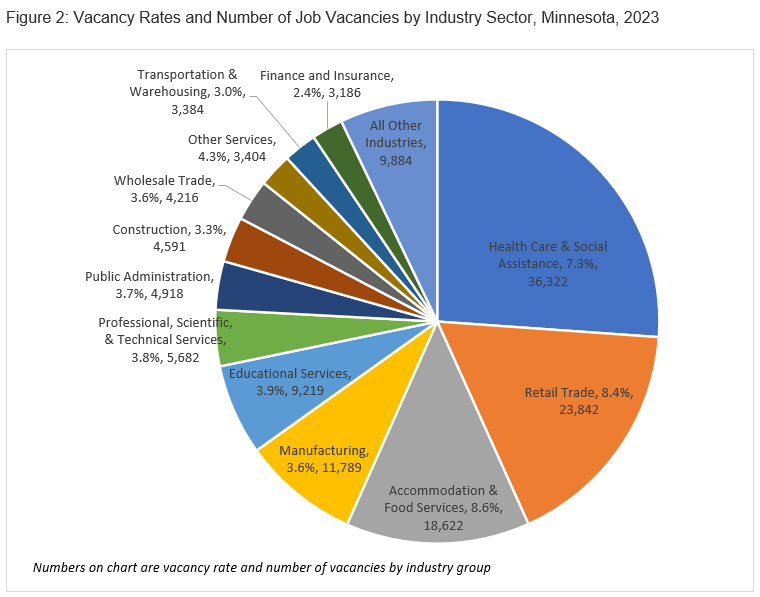
Statewide, the Health Care & Social Assistance industry had the most job vacancies with more than 36,000 openings, followed by Retail Trade with almost 24,000 vacancies, Accommodation & Food Services with 18,600 postings, and Manufacturing with almost 11,800 vacancies. Combined, those four industries accounted for almost two-thirds of the total openings in the state (see Figure 2).
Three industries had a job vacancy rate that was higher than the state’s (5.1%): Accommodations & Food Services had the highest vacancy rate of any industry at 8.6% followed by Retail Trade at 8.4% and Health Care & Social Assistance at 7.3%.

Three industries saw an increase in job vacancies over the year including Public Administration, Utilities, and Management of Companies & Enterprises. The remainder saw decreases with the largest in Health Care & Social Assistance, Accommodation & Food Services, Manufacturing, Retail Trade, Educational Services, Finance & Insurance, Administrative & Waste Services, Professional & Business Services and Transportation & Warehousing.
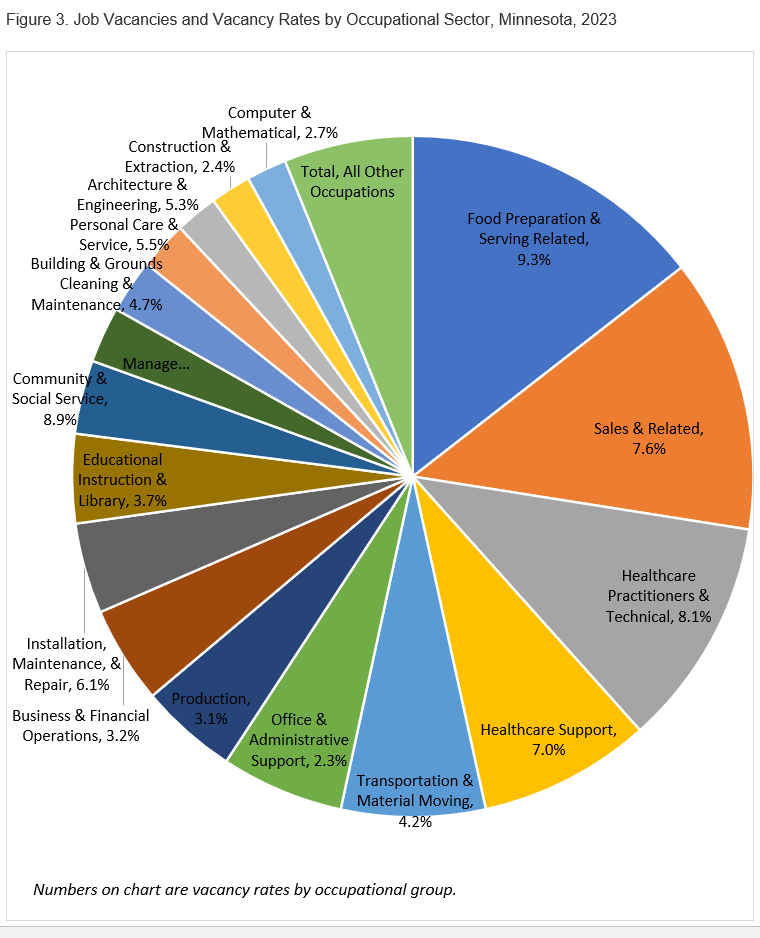
By occupational group, Food Preparation & Serving had the most job vacancies with just over 20,100 postings and a vacancy rate of 9.3%, followed by Sales & Related with 18,100 vacancies and a vacancy rate of 7.6%, Healthcare Practitioners & Technical with just over 15,100 openings and a vacancy rate of 8.1%, Healthcare Support with almost 11,400 openings and vacancy rate of 7.0% and Transportation & Material Moving with 9,500 openings and a vacancy rate of 4.2%.
Five occupational groups saw small increases compared to second quarter 2022: Internships, Apprenticeships, Protective Service, Legal and Community & Social Service occupations. All other groups saw losses compared to second quarter 2022, with the largest declines in Food Preparation & Serving, Sales & Related, Production, Healthcare Support, Transportation & Material Moving, Healthcare Practitioners & Technical and Building & Grounds Cleaning & Maintenance occupations.

The 10 detailed occupations with the most job vacancies during 2023 were Retail Salespersons with 7,599 vacancies and a vacancy rate of 11.4%, Personal Care Aides with 5,669 vacancies, Fast Food & Counter Workers with 5,648 vacancies with a vacancy rate of 10.5%, Registered Nurses with 4,382 vacancies and a vacancy rate of 6.9%, First-line Supervisors of Food Prep and Serving Workers with 4,156 vacancies and a vacancy rate of 24.4%, Cashiers with 3,334 vacancies and a vacancy rate of 5.8%, First-Line Supervisors of Retail Sales Workers with 3,075 vacancies and a vacancy rate of 16.1%, Nursing Assistants with 2,591 vacancies and a vacancy rate of 10.4%, Heavy & Tractor-Trailer Truck Drivers with 2,299 vacancies and a vacancy rate of 6.5% and Stockers & Order Fillers with 2,259 vacancies and a vacancy rate of 5.4%.
By size, medium to small size firms with 10 to 49 employees had the highest job vacancy rate at 7.9%, followed by small firms with 1 to 9 employees, at 6.4%. The largest firms, those with 250 or more employees, had the lowest vacancy rate at 3.0%. These largest firms also had the highest median wage offer ($23.88 per hour).
Along with the number of vacancies, employers also report on the characteristics of their job vacancies. Some key characteristics of 2023 Minnesota job vacancies are as follows:
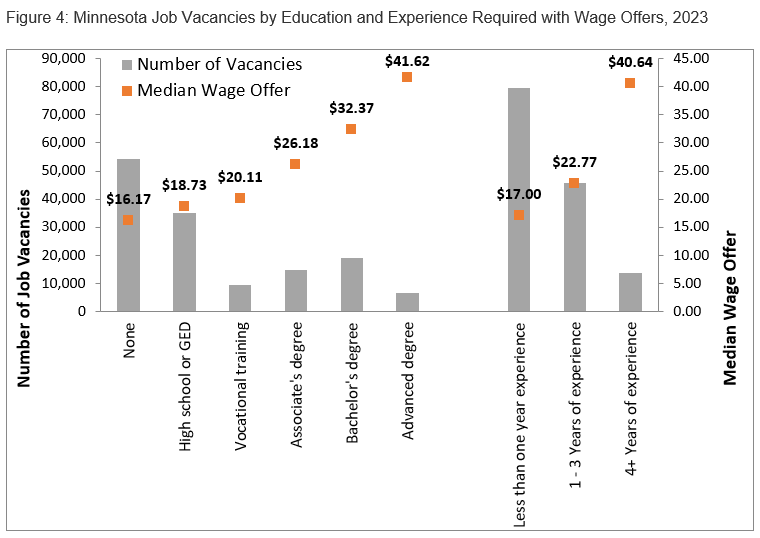
The median (50th percentile) wage offer for all job vacancies is $19.68 per hour in 2023. This is easily the highest median wage offer in the history of the Job Vacancy Survey, reflecting both employers offering higher starting wages and a changing mix of available occupations. As Figure 4 illustrates, wage offers are highly correlated with experience and education requirements.

Jobseekers and employers want to know who is hiring and for what fields of work. Job vacancy counts alone are not a complete picture of labor market demand since larger occupations tend to have higher numbers of vacancies. Occupations in Demand (OID) provides a ranked list of occupations currently in demand, along with links to occupational descriptions, wages and programs of study. Lists are available for Minnesota as well as the 6 sub-state planning regions. These lists use measures of demand from Job Vacancy Survey statistics as well as other sources of data including Unemployment Insurance claimants and Occupational Employment & Wage Statistics.
Employers provide information on their job vacancies twice a year to enable us to estimate hiring demand and job vacancy characteristics by industry, occupation and firm size in Minnesota. The information is gathered through a survey of 6,996 firms stratified by 6 regions of the state, 20 industry sectors, and 4 size classes. This sample is split between the two rounds, second and fourth quarters of each year. The 2023 survey had a response rate of 92.4% across both rounds.
These data provide job seekers and counselors with information on occupations showing hiring demand within their region. The information also helps employment, training and education providers understand current labor market conditions in their region and tailor services to better meet customer and employer needs. Finally, the data provides a leading labor market indicator.