by Dave Senf
July 2018
Note: All data except for Minnesota’s PMI have been seasonally adjusted. See the feature article in the Minnesota Employment Review, May 2010, for more information on the Minnesota Index.
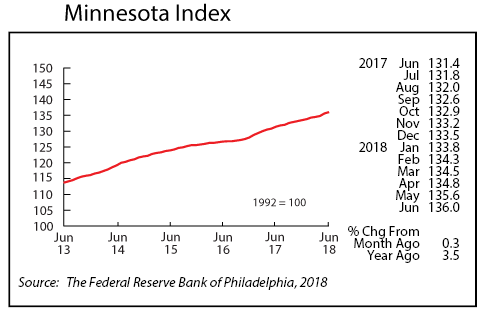
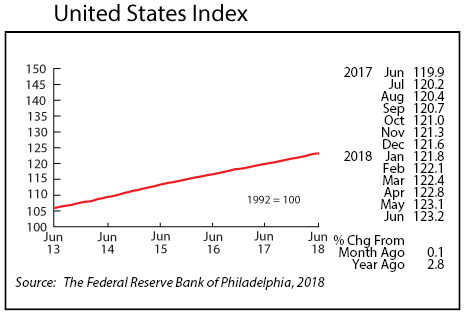
The Minnesota Index downshifted a bit in June, advancing 0.3 percent compared to May’s 0.5 percent increase, as Minnesota’s economy expanded for the 22nd straight month. The index continued to show solid growth fueled by increasing wage and salary employment and climbing real wage and salary disbursements. The index combines Minnesota’s nonfarm payroll employment, average hours worked in Manufacturing by production workers, inflation-adjusted wage and salary disbursements, and the unemployment rate to summarize current economic conditions in Minnesota in one single statistic.
The comparable U.S. index increased 0.1 percent in June. Minnesota’s index was up 3.5 percent from a year ago while the U.S. index was 2.8 percent higher over the same period. Minnesota’s over-the-year increase has been above the U.S. increase since March 2017.
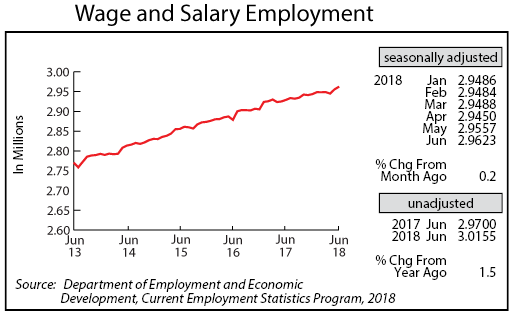
Minnesota’s adjusted Wage and Salary Employment, after getting off to a slow start earlier in the year, recorded strong growth for the second month in a row in June. Employers added 6,600 jobs with private sector employers adding 7,600 jobs and public sector employers cutting 1,000 jobs. June hiring was strongest in Leisure and Hospitality, Manufacturing, and Construction. Construction employment increased by 1,500 jobs, reaching its highest level since January 2007, while Manufacturing employment increased for the sixth straight month, expanding to its highest total since December 2008.
Minnesota’s unadjusted over-the-year job growth spiked again in June to 1.5 percent, the highest increase since last June. Minnesota’s over-the-year job growth, however, remained below the national rate of 1.7 percent in June. Through the first six months of the year Minnesota’s unadjusted over-the-year job growth has average 0.9 percent compared to the 1.6 percent for the U.S.
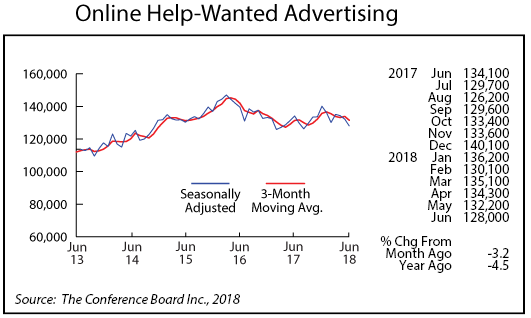
Online Help-Wanted Ads inched down for the third month in a row to 128,000. Job postings slipped 3.2 percent in Minnesota and 3.7 percent across the U.S. The state’s unemployed workers to online help-wanted ads ratio in June, as reported by the Conference Board, was 0.74, tied with Colorado for the third lowest ratio behind Hawaii and North Dakota. The national ratio was 1.46 with nine states below 1.0 including three neighboring states – Iowa (0.83), North Dakota (0.66), and Wisconsin (0.94).
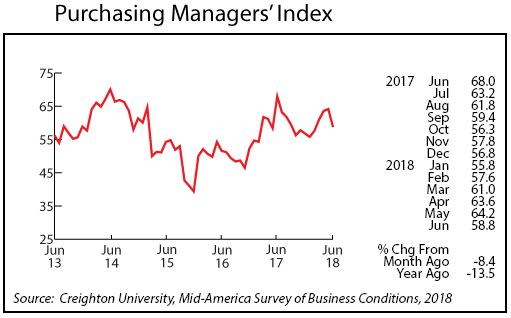
Minnesota’s Purchasing Managers’ Index (PMI) unexpectedly dipped in June, trailing off to 58.8, the lowest reading since February. Minnesota’s PMI has averaged 54.1 since first being published in 1994. The Mid-America Business Conditions Index, which includes Minnesota along with eight other states stretching from Arkansas to North Dakota, also retreated in June, slipping to 61.8. The U.S. PMI rose to 60.2 indicating continued expanding Manufacturing strength across most of the nation.
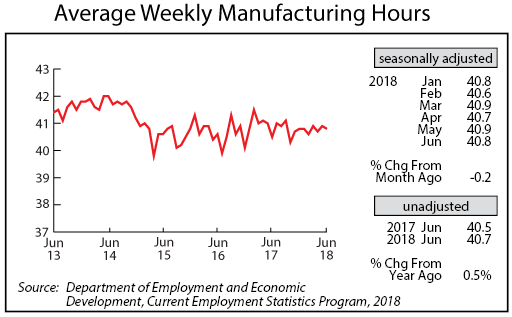
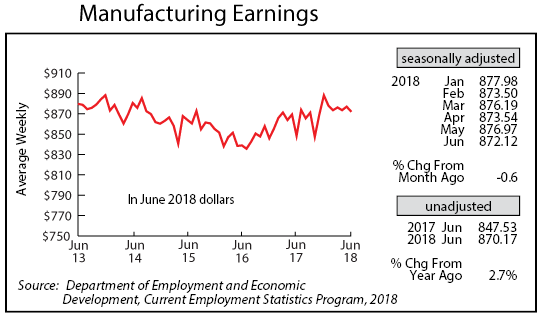
Adjusted average weekly Manufacturing Hours inched down to 40.8 hours in June. Average factory hours have averaged 40.8 hours over the first half of this year which is down slightly from the 41.0 hours average reported over the first half of 2017. Average weekly Manufacturing Earnings, adjusted for inflation and seasonality, tailed off to $872.12 in June. Factory earnings, however, remain higher than a year ago for the 18th month in a row. During that stretch real factory earnings have average 2.1 percent higher than a year ago.
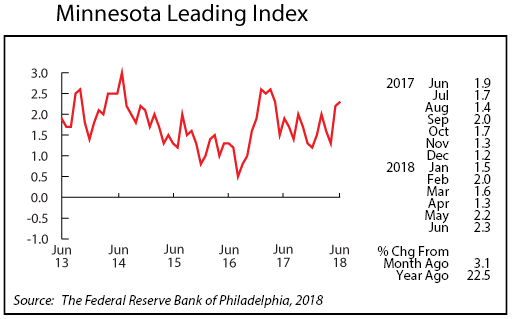
The Minnesota Leading Index inched up in June to 2.3, reaching its highest level since April 2017. The leading index predicts the six-month growth rate of the Minnesota Index, which is a proxy for economic activity in the state. The 2.3 reading suggests that Minnesota’s economy will continue to grow at a robust pace through the rest of the year.
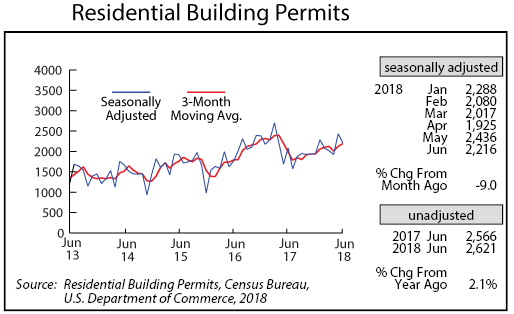
Adjusted Residential Building Permits dipped a tad in June to 2,216. Home-building permits through the first half of 2018 were down 1.5 percent compared to the first half total in 2017. Unadjusted home-building permits during the first half of 2016 were 9,280, 12,150 in 2017, and 11,970 this year. Home-builders have stated that home-building activity would be higher but is being held down by a shortage of construction trade workers.
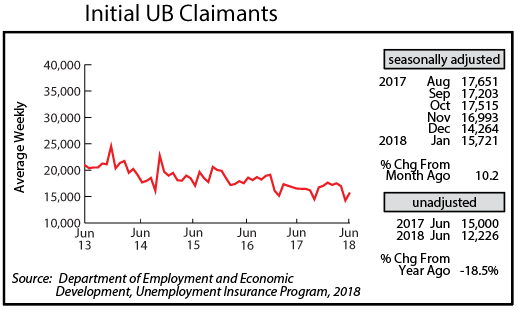
The number of Minnesotans claiming new unemployment benefits rose in June, pushing adjusted Initial Claims for Unemployment Benefits (UB) to 15,721, but remained near multi-decade lows. The low initial jobless claims level continues to signal that relatively few Minnesota workers are being laid off or may not be filing claims for unemployment benefits and that the state’s job market remains robust. Minnesota’s job growth should remain above 1 percent for the rest of the year if employers can find enough workers to fill the high level of job openings that exist.