by Nick Dobbins
March 2015
Monthly analysis is based on unadjusted employment data.
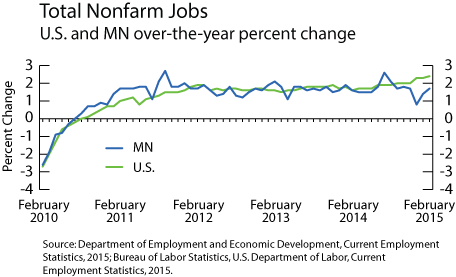
Employment in the Minneapolis-St. Paul MSA increased in February with the area adding 10,630 jobs (0.6 percent). The growth was largely thanks to significant spikes in a small handful of industries with the remaining showing losses or less dramatic movement in either direction. The supersectors to add the most jobs were Educational and Health Services (up 5,223, 1.7 percent), which added most of its employment in Educational Services, and Government (up 6,473, 2.6 percent), where the lion's share of the growth came from State Government Educational Services. February job growth is common in both of those areas, likely at least in part from schools' returning from Winter/Holiday break. The biggest monthly losses came in Mining, Logging, and Construction (down 1,492, 2.4 percent) and Trade, Transportation, and Utilities (down 1,741, 0.5 percent). On an annual basis the metro added 37,662 jobs (2 percent). The only supersectors to shrink were Financial Activities (down 230, 0.2 percent) and Information (down 293, 0.7 percent). The rest of the supersectors showed a fairly consistent level of over-the-year employment gains, with the largest numerical increase coming in Professional and Business Services (up 11,240, or 3.9 percent) and Educational and Health Services (up 6,581, 2.2 percent).
The Duluth-Superior MSA added 380 jobs (0.3 percent) in February. The largest contributor to the growth was Government which added 429 jobs (1.7 percent), and more specifically Local Government, which added 353 jobs (2 percent). The largest job losses came in Trade, Transportation, and Utilities, which dropped 212 jobs (0.8 percent) as all three component sectors lost employment. Wholesale Trade was down 37 or 1.1 percent, Retail Trade dropped 117 or 0.8 percent, and Transportation, Warehousing, and Utilities shed 58 jobs or 0.9 percent. The Duluth metro lost 913 jobs (0.7 percent) over the year. The loss is in part caused by steep declines in Government employment (down 1,075 or 4 percent on the year) and Educational and Health Services (down 612 or 1.9 percent). The largest numerical increase came in Trade, Transportation, and Utilities, which added 870 jobs (3.6 percent) over February 2014.
Employment in the Rochester MSA was down 311 (0.3 percent) in February. It was the only MSA to lose employment for the month. This marked the third straight month that Rochester lost jobs. The largest numerical drop came in Trade, Transportation, and Utilities (down 206, 1.2 percent), and the steepest proportional decline occurred in Mining, Logging, and Construction (down 59, 1.6 percent). However, between Februarys 2014 and 2015, Rochester still added 1,286 jobs (1.2 percent). The growth was spread across industries, as the only supersectors to shed jobs over that time were Manufacturing (down 82, 0.8 percent) and Professional and Business Services (down 117, 2.1 percent). The largest over-the-year increase came in Government which added 382 jobs (3.1 percent), most of which is attributable to an increase of 293 jobs or 3 percent in Local Government employment. State Government employers also added 94 jobs, a 6.2 percent increase on the year.
The Saint Cloud MSA added 467 jobs (0.4 percent) for the month of February. Government employers added 576 jobs (3.8 percent), and Educational and Health Services added 300 (1.4 percent) which accounted for much of the growth. The largest losses came in Trade, Transportation, and Utilities which dropped 357 jobs (1.7 percent). On the year St. Cloud added 1,084 jobs (1 percent). The growth was fairly well distributed with the losses concentrated in Professional and Business Services (down 751, 8.5 percent) and Government (down 198, 1.2 percent). Educational and Health Services added 824 jobs or 3.9 percent, giving the largest numerical and proportional growth of the prior 12 months.
Employment in the Mankato-North Mankato MSA grew by 573 jobs (1 percent) in February. Goods Producers lost 99 jobs (1 percent) while Service Providers added 672 (1.5 percent). For the year the Mankato area added 1,023 jobs (1.9 percent). Private Employers added 992 jobs (2.2 percent) while the Government added 31 (0.3 percent). Service Providers in the area added 627 jobs (1.4 percent) on the year, and Goods Producers added 396 (4.2 percent).
The Fargo-Moorhead MSA added 840 jobs in February. A loss of 317 (1.9 percent), entirely from the Retail Trade sector, was overcome by strong gains in Leisure and Hospitality (up 208, 1.5 percent), Government (up 513, 2.8 percent), and Professional and Business Services (up 220, 1.4 percent), among other supersectors. Over the year Fargo-Moorhead added 5,832 jobs (4.4 percent), with every supersector and published industry group showing gains.
The Grand Forks-East Grand Forks MSA added 314 jobs (0.6 percent) in February. By far the biggest gains came in Government employment which added 263 jobs (1.8 percent). Mining, Logging, and Construction also had a relatively good month, adding 60 jobs (2.3 percent). Annually the MSA added 1,205 jobs (2.2 percent) with huge proportional gains in Mining, Logging, and Construction (up 268, 11 percent) and Professional and Business Services (up 333, 11.8 percent).
