by Dave Senf
September 2019
Diffusion indexes tell us about employment change across industries.
Each month the Bureau of Labor Statistics (BLS) releases the Employment Situation Summary which is widely followed primarily for the latest monthly U.S. payroll employment and unemployment rate estimates.1 A ton of other monthly labor market measures are also released in the report (27 tables of data are published each month) including the Diffusion Index.2 There are actually two diffusion indexes listed, the Total Private Index (258 industries) and the Manufacturing Index (76 industries).
The two diffusion indexes measure the dispersion of employment change across industries each month.3 Each industry is assigned a value of 0, 50, or 100 percent, depending on whether industry employment decreased, stayed the same, or increased over the month. The average across industries is then calculated to produce the diffusion index. Diffusion indexes can vary between 100 and 0, with 100 indicating that employment in every industry increased over the month and 0 indicating that all industries lost employment. A 50 percent index indicates an equal balance between industries with increasing and decreasing employment.
Diffusion indexes are derived for many economic and financial statistics including stock prices. A high stock diffusion index signals that the underlying strength of the stock market is strong since more stock prices are advancing than retreating. The same goes for employment-based diffusion indexes. A higher employment diffusion index indicates that employment growth is widespread across industries while a lower index indicates that employment growth is scattered across fewer industries.
Two time periods might have the same overall rate of employment growth but during one period most industries added jobs while during the other period only a few industries added jobs. Tracking the diffusion number alongside aggregate employment growth adds insight into the strength and direction of employment growth.
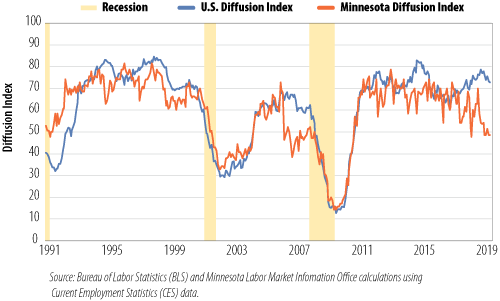
Figure 1 displays 12-month diffusion indexes for Minnesota (64 industries) and U.S. (258 industries) private employment from January 1991 through June 2019.4 Recession periods are shaded in the figure since diffusion indexes can help identify economic turning points. Diffusion indexes usually climb during expansions while declining diffusion values appear when economic growth slows. Employment diffusion values below 50 occur during recessions.

Minnesota's diffusion index has generally tracked the national index over the last three decades, but there have been extended periods when Minnesota's index diverged from the U.S. index. The Minnesota index briefly fell below 50 during the 1990-91 recession but quickly rebounded over the next two years as job growth was more widespread in Minnesota than nationally. Both indexes began to decline a few months before the 2001 recession but didn't fall below 50 until after the recession was later designated to have started.
Minnesota's index took a noticeable plunge in early 2006 and was below 50 for most of 2007 even though the 2007-2009 recession didn't officially start until December 2007. Minnesota's housing bust occurred a year earlier than nationally and resulted in declining employment in construction and construction-related industries. During the 2001 recession 35 percent of Minnesota industries were still adding workers compared to less than 15 percent during the 2007-2009 recession.
Minnesota's index has slipped significantly below the national index over the last two years and has been below 50 for four of the first six months in 2019. Is the index signaling a recession in Minnesota? Probably not since the industrial employment estimates from October 2018 to June 2019 are subject to benchmarking (revisions) next March.5 Employment levels for those nine months are likely to be revised upward for a number of industries which will push the diffusion index above 50. Caution should be used when evaluating the health of Minnesota's economy using real-time data that will be revised later.
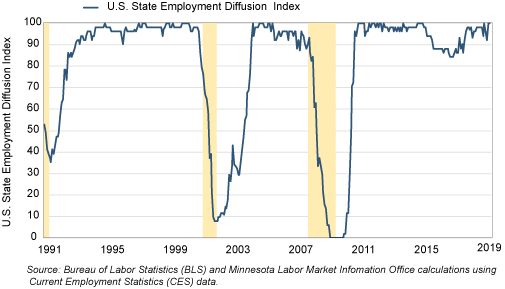
Last year the BLS started to publish another set of employment diffusion indexes that measure how widely national employment growth is spread across states and Metropolitan Statistical Areas (MSAs).6 The state employment index is displayed in Figure 2. The dip in the index in 2015-16 reflects employment decline in a number of oil-producing states when oil prices tailed off to $40 per barrel. The most current diffusion index readings show that job growth is occurring across almost all states.

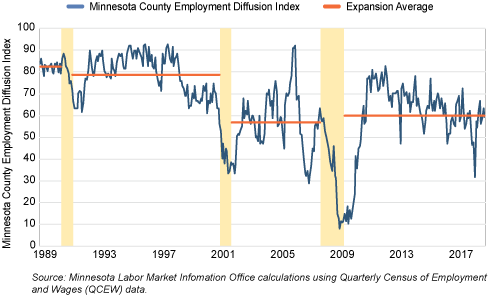
Figure 3 reproduces the BLS state employment index but uses county employment totals across Minnesota instead of state employment. The Minnesota County Employment Diffusion Index measures how widely county employment changes are spread across the state. County diffusion levels were much higher during the 1980s and 1990s than over the last two decades. The downward trend in the index is a handy measure of how job growth in the state has become more concentrated geographically over the last 40 years. Just under 80 percent of Minnesota counties were adding employment in the 1991-2001 expansion compared to 60 percent of counties during the current expansion. The decline in job growth in some areas of Minnesota reflects slowing or declining labor force growth in those areas and is most likely a harbinger of job growth becoming even more concentrated in the state in the future.

1Employment Situation Summary.
2The index is at the bottom of the Employment Situation Summary Table B.
3Additional Employment diffusion indexes are available at the BLS website that compare employment change over three, six and 12 months.
4Greater industry details are available nationally rather than at the state level since the survey used to estimated monthly payroll employment numbers is designed to generate statistically valid national estimates.