by Dave Senf
February 2021
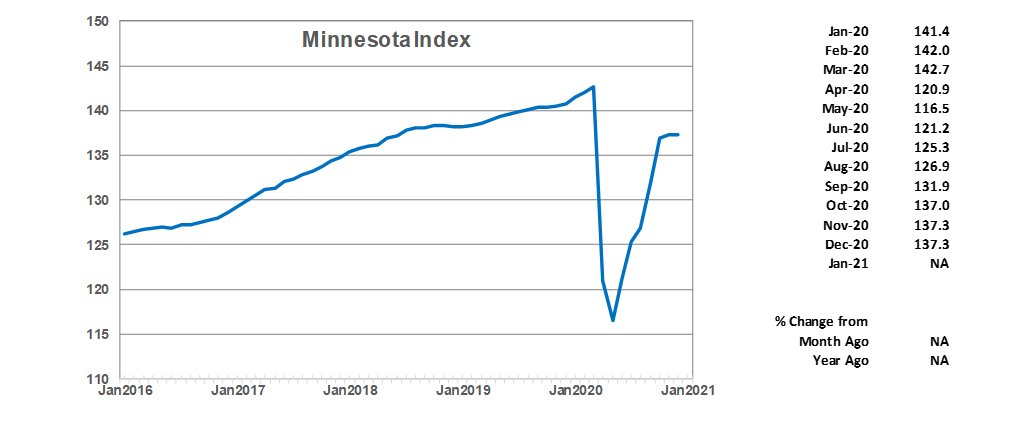
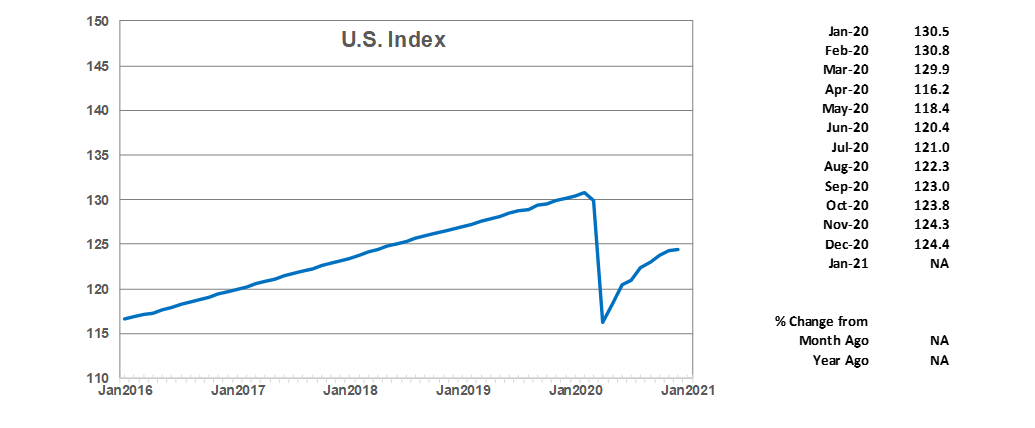
The Minnesota Index and U.S. Index are generated by the Philadelphia Federal Reserve Bank. At the beginning of each year the indices are delayed by two months as revised component numbers are used to recalibrate the indices. January's indices, as well as revisions to past indices were made available on April 2.
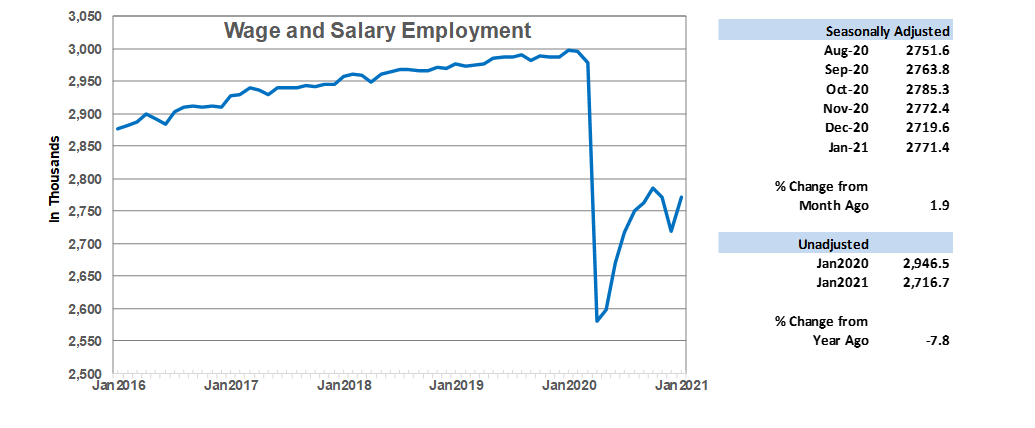
Wage and Salary Employment rebounded in January as restrictions on bars, restaurants, and entertainment venues were relaxed. After a loss of 52,800 jobs in December, payroll numbers jumped by 51,800 in January. January's 1.9% increase easily surpassed the U.S. 0.1 percent January increase. January's job gain translates to Minnesota's having recovered roughly 46.0% of the 416,000 jobs lost in March and April through January. The job loss in March and April was revised higher with recent annual benchmarking. The state lost 13.9% of its February 2020 job base in March and April last year. Nationally 55.9% of the 22.3 million jobs lost across the nation in March and April have been recovered as of January. The U.S. loss 14.7% of its February 2020 job total in March and April last year.
Most of the employment increase in January was in Leisure and Hospitality which added 35,500 jobs as bar and restaurant workforces bounced back. Educational and Health Services, Other Services, and Government payrolls also record large increases. Only two supersectors, Construction and Financial Activities, recorded job losses which in both sectors was minimal.
Minnesota's unadjusted employment in January was down 7.8% or 230,000 jobs from a year ago. Unadjusted employment nationwide was 6.1% below 12 months ago or roughly 9.1 million jobs.
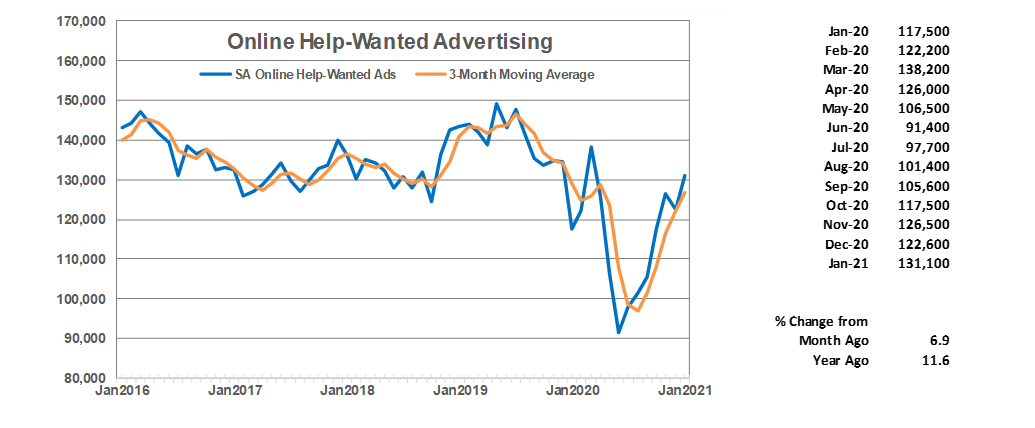
Online Help-Wanted Ads, after dipping in December, increased in January to 131,100, its highest level since last March. Online job postings nationally increased 4.0% while climbing 6.9% in Minnesota in January. Online help-wanted ads in the state are down 5.1% between March 2020 and January 2021 compared to a 0.5% increase nationwide over the same period. Minnesota's share of U.S. online job postings was 2.1% in January which was just a tad below the 2.2% share average for all of 2020.
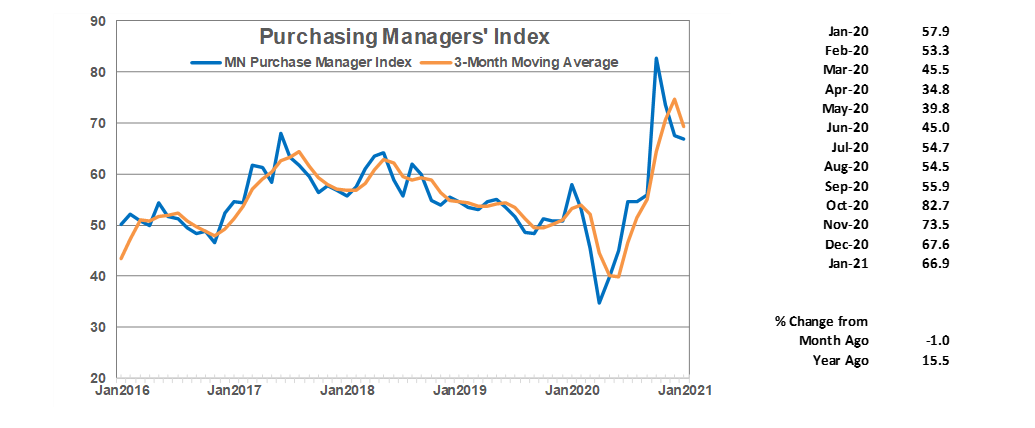
Minnesota's Purchasing Managers' Index (PMI) recorded its third consecutive decline in January after setting a record high in October. December's 66.9 reading is still very strong by historical standards as the 26-year average for the index is 54.1. The robust reading indicates that Minnesota manufacturers expect manufacturing activity to continue to accelerate over the next few months. The index ranges from 0 to 100% with a reading above 50 indicating expansion over the next six months.
The national ISM Manufacturing Index also slipped in January to 58.7 while the Mid-America Business Index (nine states including Minnesota) increased to 67.3. Manufacturing in Minnesota as well as most regions of the country have gained momentum over the last few months and are expected to continue to expand production over the next few months.
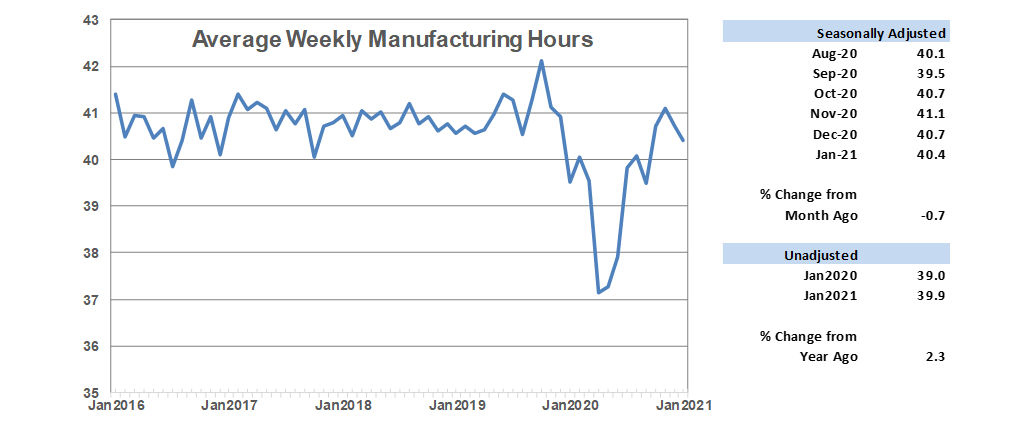
Average weekly Manufacturing Hours retreated for the second month in a row, falling to 40.4 hours after having peaked in November at 41.1 hours. January's 40.4 hour factory workweek is just below the 50-year average of 40.5 hours. The average factory workweek suggests that while manufacturing is picking up steam in Minnesota it has not reached pre-pandemic levels.
Minnesota manufacturers cut 22,000 jobs in March and April last year or about 6.7 percent of its workforce. U.S. manufacturing jobs were reduced 10.8% during the same period last year. Minnesota's manufacturing employment in January was still 4.6% below the February 2020 level while nationwide manufacturing employment was 3.9 percent short of the February 2020 level. Minnesota's manufacturing sector has – at least through January – recorded a slower factory job rebound than the national rebound. All of Minnesota's manufacturing job rebound has been in nondurable goods manufacturing as durable goods manufacturing payrolls have been essentially flat since the pandemic hit.
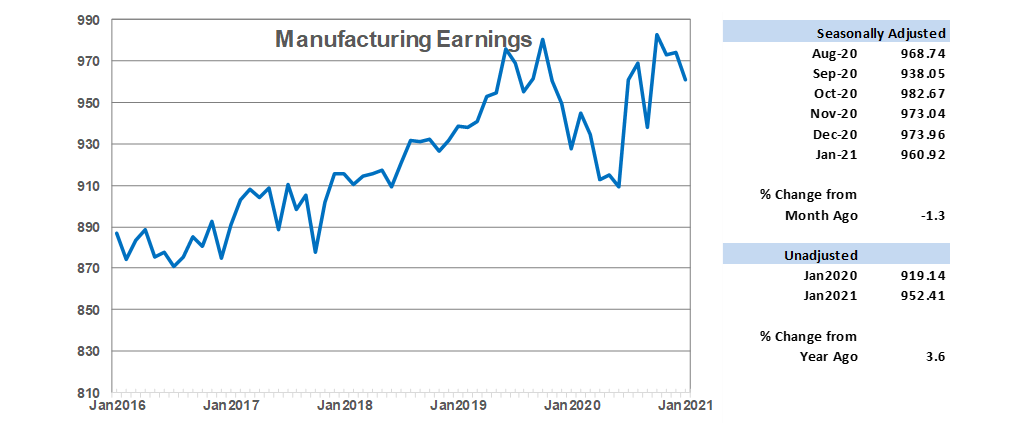
Average weekly Manufacturing Earnings inched down in January to $960.92, the lowest factory paycheck in four months. Despite the drop, January's weekly factory paycheck remains high compared to recent levels. Inflation-adjusted 2019 annual average manufacturing earnings were $956.35. January's unadjusted real earnings were 3.6% higher than a year ago.
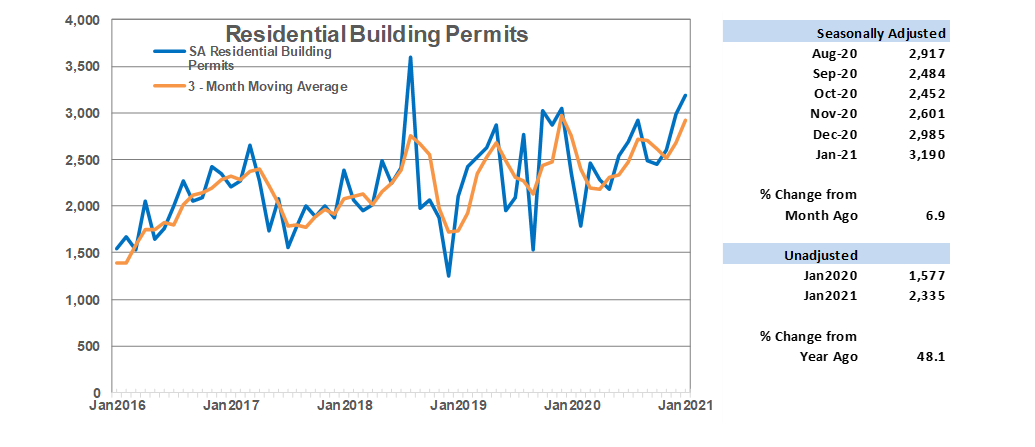
Adjusted Residential Building Permits rose for the fourth consecutive month, climbing to 3,190, the highest monthly total since August 2018. January's strong home-building permit start suggests that home-building activity will continue to remain strong in the state in 2021.The low inventory of existing homes for sales plus low mortgage rates apparently will continue to fuel robust home building activity in Minnesota for another year.
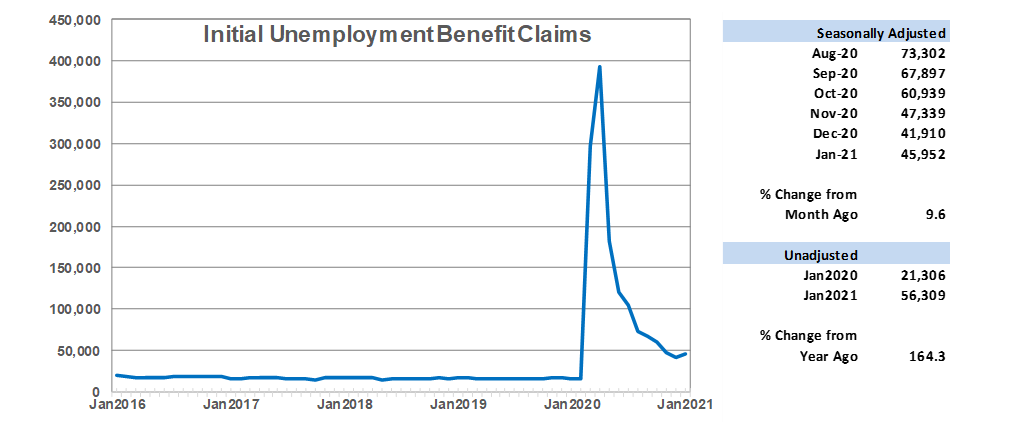
Adjusted Initial Claims for Unemployment Benefits (UB) climbed for the first time since peaking in April as reinstatement of eating and drinking establishments restrictions in December apparently carried over into January adding to higher filings for unemployment benefits. Initial claim levels continue to run well above normal rates with January's unadjusted count being almost two and a half higher than last January. Seasonally adjusted initial claims during the 19-month Great Recession (December 2007 to June 2009) averaged 29,740 compared to January's 45,952 initial claims.
Note: All data except for Minnesota's PMI have been seasonally adjusted. See the feature article in the Minnesota Employment Review, June 2010, for more information on the Minnesota Index.
The Philadelphia Federal Reserve Bank, which produces the Minnesota Leading Index, has temporary suspended generation of state leading indices.