by Dave Senf
April 2015
Note: All data except for Minnesota’s PMI have been seasonally adjusted. See the feature article in the Minnesota Employment Review, May 2010, for more information on the Minnesota Index.
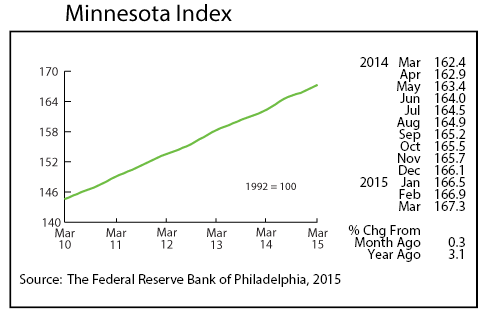
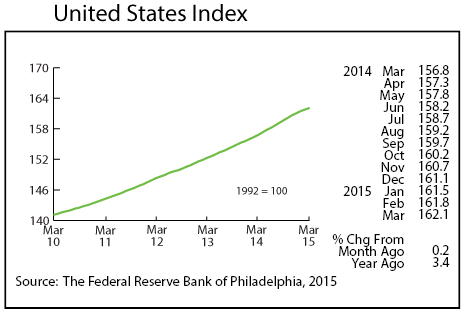
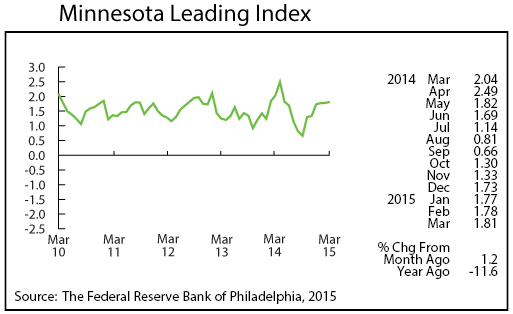
After a few months of extensive review of their process for producing coincident and leading indices, the Philadelphia Federal Reserve Bank has published revised indices for all 50 states. The Minnesota Index, which had previously been reported as flat in December, was revised upwards, starting a four month upswing. March’s 0.3 percent increase, the second straight month of 0.3 percent increases, indicates that the Minnesota economy, after slowing during the second half of 2014, is again picking up steam. Minnesota’s index lagged behind the U.S. index for most of the last half of 2014 but has outpaced the U.S. index over the last two months.
Minnesota has recorded solid wage and salary employment growth over the past two months which has boosted the index, but the unemployment rate has been stuck at 3.7 for eight months. Slow job growth was the reason for the flat unemployment rate during the second half of last year. The 3.7 percent pause in the unemployment rate over the last couple of months can be traced to positive developments. Minnesota’s labor force growth has accelerated over the last few months, recording monthly increases not seen since 2009. The state’s labor force surpassed 3 million for the first time ever in both February and March. Solid job growth combined with an uptick in labor force growth is a welcome development.
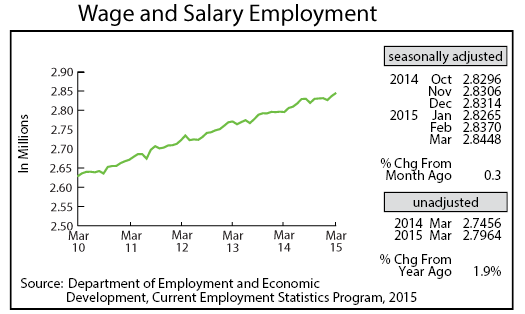
Adjusted Wage and Salary Employment climbed sharply for the second straight month in March with jobs jumping 7,800. The most recent two-month average job gain is the strongest since July 2014. The private sector job increase over the last two months hasn’t been this high since February 2013. Hiring was strong in Educational and Health Services, Trade, Transportation, and Utilities, Government, and Manufacturing. Four sectors lost jobs in March with most of the layoffs occurring in Professional and Businesses Services.
Minnesota’s unadjusted over-the-year job growth continued to improve, increasing to 1.9 percent in March. That is the highest over-the-year increase since last August. Minnesota has trailed the nation in over-the-year growth since last July. U.S. employment in March was up 2.3 percent from a year ago.
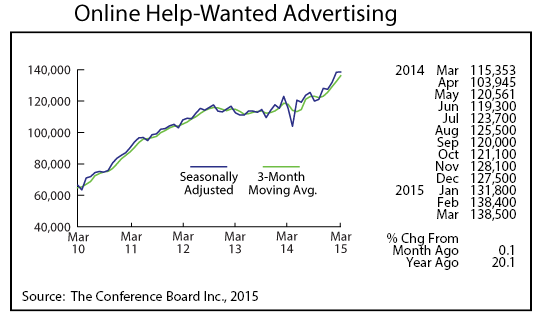
Minnesota’s adjusted online Help-Wanted Ads inched up in March, increasing 0.1 percent compared to the national 0.3 percent increase. Online help-wanted ads have climbed in five of the last six months in Minnesota, indicating that labor demand remains strong in the state. Minnesota’s ad level is 18.5 percent higher than a year ago, which is significantly above the 11.4 percent increase experienced nationally.
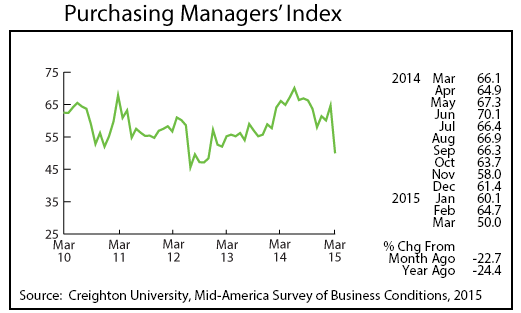
Minnesota’s Purchasing Managers’ Index (PMI) plummeted to 50.0 in March, signing that Minnesota’s economic expansion has nearly stalled out. March’s index is the lowest reading since November 2012. The steep drop, the third largest dating back to 1994, however, is completely inconsistent with most indicators. Minnesota’s PMI had a similar steep decline in July 2012 followed by four more months of reading below 50. Average monthly job growth during that period worked out to 2.1 percent on an annual average basis, suggesting that the subpar PMI warnings were way off in 2012. March’s subpar reading looks at least for now like another erroneous signal.
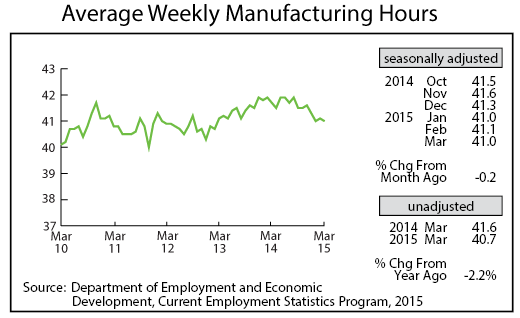
After inching up in February, adjusted Manufacturing Hours inched down in March to 41.0. While factory hours are down from last year’s record setting 41.7 hour average annual workweek, Minnesota’s factory hours remain high historically. The 45-year average for non-recession months is 40.6 and for recession months 39.7. Minnesota’s manufacturing sector is still expanding based on the current level of manufacturing hours.
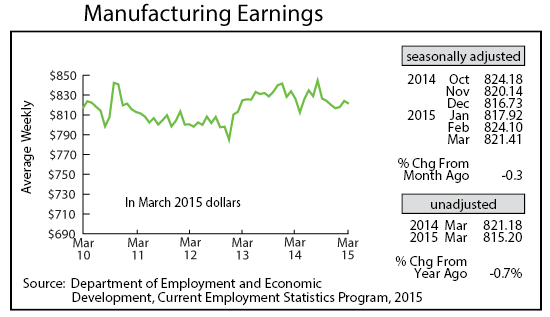
Manufacturing Earnings tailed off in March slipping to $821.41. Factory paychecks are down in real terms by 0.6 percent from a year ago.
Revised numbers for the Minnesota Leading Index show a six-month rebound following a five-year low in September 2014. March’s 1.81 reading is the highest since last May and suggests that Minnesota’s economy will be expanding by more than a 3 percent annual average clip over the next six month.
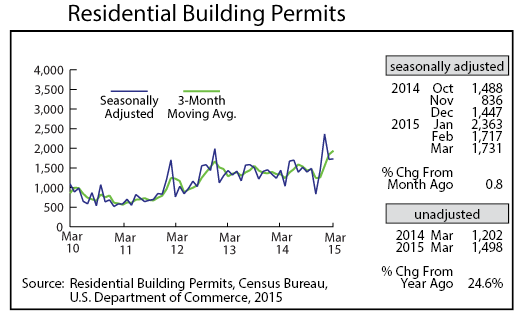
Adjusted Residential Building Permits inched up in March to 1,731. The average over the last three months was 1,937 which is the highest three-month average since January 2007. The average monthly level is 2,120 over the 45-year series.
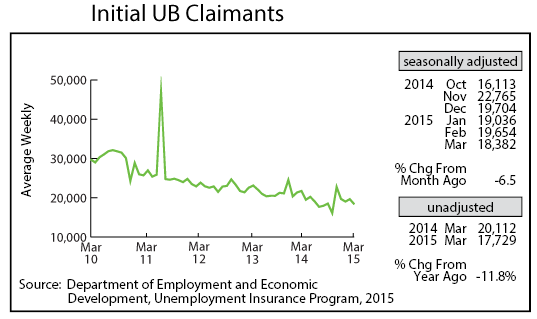
Adjusted Initial Claims for Unemployment Benefits (UB) dipped to 18,382 in March, the lowest total in five months. Initial claims are down 11.8 percent from last year on an unadjusted basis, suggesting that Minnesota’s job growth should remain solid over the next few months.
