by Dave Senf
December 2017
Jobs are growing at a steady pace in low- and high-wage fields in Minnesota, but many middle-wage occupations are stagnant or shrinking, particularly in rural Minnesota.
Minnesota had 2.8 million wage and salary jobs in 2016, with half of the jobs paying from $26,420 to $62,570 per year, according to wage data from the Occupational Employment Statistics (OES) program.1 Another quarter of jobs were in occupations that paid less than $26,420 (the 25th percentile) annually, while the remaining quarter of jobs paid above $62,570 (75th percentile) per year. That wage distribution, which changes from year to year, applies only to last year.
The big question is how has employment distribution by wage or skill-level shifted over time? Has job growth occurred faster in low-wage occupations than in middle- and high-wage positions? An equally important question is how have the pay differences between low-, middle-, and high-wage occupations shifted? Are high-wage occupations making relatively more than middle- and low-wage jobs now than 10 years ago?
Most of the relevant research has concluded that employment in low- and high-wage occupations has expanded at a faster clip than employment in middle-wage jobs in the U.S. The shift has been going on for over three decades and appears to speed up during recessions, when job loss is concentrated in middle-wage occupations.
The widening wage gap between high-wage and low-wage jobs over time also has been confirmed.
These two key labor market developments have come to be known as “job polarization,” which has been documented in the United States and across most other developed countries. The two most common explanations for the concentration of employment growth in high- and low-wage occupations are technological advancements and globalization. Another factor that receives less attention is the ongoing shift in the mix of goods and services demanded by consumers.
Increasing use of information technology across almost all industries has increased the demand for highly-skilled, highly-paid workers, while decreasing the demand for workers who perform routine tasks.
Many jobs in the office and administrative support occupational group involve routine work. Many of the routine tasks have been automated with information technology, leading to office and administrative support employment tailing off by 9 percent between 1999 and 2016 in Minnesota. Computer and mathematical occupational jobs, on the other hand, have surged by 39 percent since 1999 in the state.
Production jobs – found primarily in manufacturing industries – have declined by 9 percent over the same period in Minnesota, due to a combination of technological advancement and globalization. The percent of manufacturing jobs lost due to automation and increasing productivity as opposed to offshoring remains a widely-debated topic, as shown in last year’s presidential election.
U.S. consumers, including Minnesota households, are increasing their consumption of services at a faster pace than their consumption of goods. Goods production disproportionally employs middle-skilled employees, while services tend to employ high-skilled and low-skilled workers who interact personally with consumers.
Minnesota employment in health care practitioner and technical occupations (high-wage jobs) has increased 36 percent over the last 17 years, while personal care and service occupations (low-wage jobs) have more than doubled over the same time according to OES data.
Employment and median annual wages across 22 major occupational groups from the Occupational Employment Statistics program are utilized here to examine job polarization in Minnesota and to determine if the wage mix of Minnesota’s employment growth differs from the national picture.
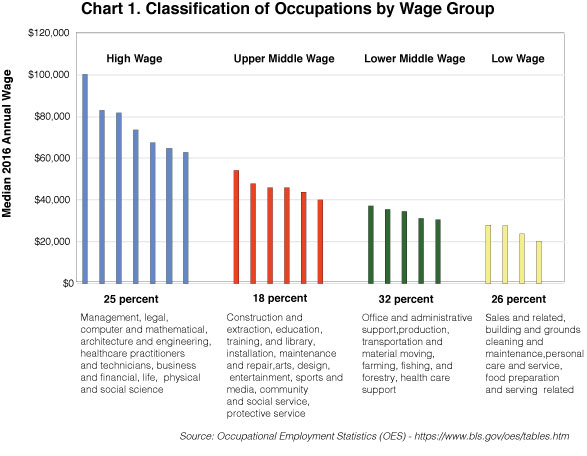
Employment is divided into four wage groups based on 2016 median annual wages for 22 major occupational groups.2 The major groups in each wage level are shown in Chart 1 along with median group wages and the percent of employment accounted for by each wage level in 2016. Wage and skill levels are highly correlated, so the wage groups can also be viewed as skill level categories.

The seven occupational groups that had median annual wages above $62,840 in 2016 are combined into the high-wage group. The upper middle-wage group includes employment in six major occupational groups, with 2016 annual median wages ranging from $54,190 to $40,100. The lower middle-wage group, with five major groups, had median annual wages from $37,180 to $30,600. The low-wage group consists of four occupational groups, all with annual median wages below $28,030.
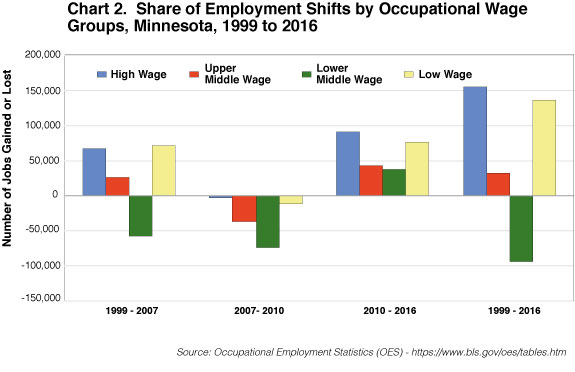
Analysis of employment shifts across the four wage groups during four periods from 1999 to 2016 clearly shows job polarization occurring in Minnesota (see Chart 2). The majority of job growth between 1999 and 2007 occurred in either high- or low-wage occupations. Employment in lower middle-wage occupations fell, even though total employment rose. During the recession, all wage levels lost jobs, but cutbacks were smallest among high- and low-wage occupations and highest in upper and lower middle-wage occupations. Job loss was especially steep in lower middle-wage occupations.

Over the last six years, Minnesota has added 248,000 jobs across all wage levels, but considerably more jobs have been added in high- and low-wage occupations than in upper and lower middle-wage occupations. Upper middle-wage job growth has been high enough since the recession to recover jobs lost during the recession, but the 37,350 jobs added in lower middle-wage occupations since the recession are far short of the 73,830 jobs lost during the recession.
Over a longer time period (the last 17 years), employment in lower middle-wage occupations is the only group to have declined. Upper middle-wage employment expanded, but the increase was far below employment expansion in high- and low-wage occupations.
Minnesota, like the nation, has been creating jobs over the last two decades, but job growth has been concentrated at the high and low ends of the wage range. Other states where job polarization has been documented include New York, New Jersey, Oregon, Missouri, Arkansas, Kentucky, Illinois and Tennessee.3
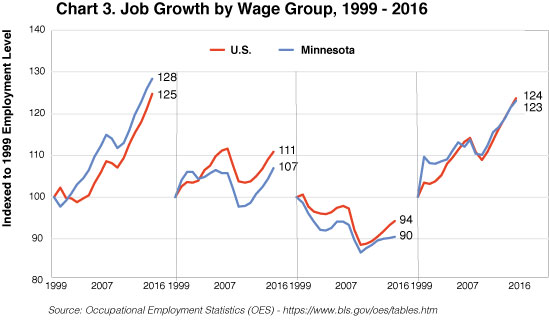
The wage mix shift of job growth in Minnesota has been similar to the nationwide shift (see Chart 3). Employment in high-wage occupations in Minnesota has increased 28 percent compared with 25 percent nationally since 1999. Employment in low-wage occupations has increased 23 percent in Minnesota, compared with 24 percent nationally. Minnesota’s employment growth in middle-wage occupations has fallen slightly short of the national pace.

Employment in lower middle-wage occupations has decreased in Minnesota and nationally since 1999. Health care support occupations are the only jobs among the five major occupational groups included in the lower middle-wage group that have increased. Employment in the other four major groups – production, office and administrative support, transportation and material moving, and farming, fishing and forestry – have all declined in Minnesota.
Lower middle-wage occupations have slipped by 6.5 percentage points from 38.2 percent of employment in 1999 to 31.7 percent in 2016 in Minnesota. Nationally the share of lower middle- wage occupations has dropped 5.5 percentage points from 37.8 percent to 32.3 percent over the same span.
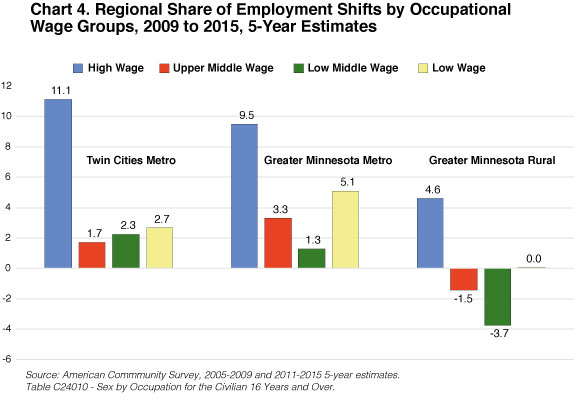
Job polarization appears to be occurring across all areas of the state, but not necessarily uniformly (see Chart 4). The same categorization of major occupational groups into four wage levels as used previously on state and national level occupational data was applied to county-level occupational data after combining Minnesota counties into three groups – Twin Cities Metro (10 counties), Greater Minnesota Metro (11 counties) and Greater Minnesota Rural (66 counties).4

The fastest-growing wage group was the high-wage occupational group in all three areas between 2009 and 2015.5 Low-wage occupation employment was the second fastest-growing wage group across each area. The slowest-growth wage group was lower middle-wage occupations in Greater Minnesota Metro and Greater Minnesota Rural, while upper middle-wage occupations were the slowest growing in the Twins Cities Metro. Total employment declined in Greater Minnesota Rural, with only employment in high-wage occupations expanding in that region.
The job polarization trend identified here is a major source of the rise in income inequality, since wage income is the main source of income for most households. Technological advances and globalization forces are unlikely to ease in the future, so job polarization is likely to continue, with new jobs being generated at the high and low extremes of the wage distribution. Middle- wage occupations are likely to continue to grow slower or even decline, which means displaced workers need to be trained with the skills to match the shifting employment picture.
This analysis brings up two important topics for future research. One topic that should be explored is matching up the education and training required to better match the type of jobs being created. A second topic is measuring the increasing wage gap between occupations requiring higher skills occupations and those requiring fewer skills. Neither of these components of job polarization was covered in this article.
Keep in mind, though, that upper and lower middle-wage occupations still account for the majority of employment and thus the majority of job opportunities. This means that education and training programs should also include middle-skilled training. Employment may be growing the fastest in high- and low-skilled occupations, but the majority of openings will continue to occur in the middle-skilled occupations.
1Minnesota Occupational Employment Statistics wage data
2The 1999-2016 Occupational Employment Statistics data used in the analysis
3Here are links to job polarization research in the other states: Federal Reserve Bank of St. Louis, Job Polarization and Rising Inequality in the Nation and the New York-Northern New Jersey Region, Job Polarization in Oregon.
4The Twin Cities Metro consists of 10 counties: Anoka, Carver, Chisago, Dakota, Hennepin, Ramsey, Scott, Sherburne, Washington and Wright. Great Minnesota Metro consists of 11 counties: Benton, Blue Earth, Carlton, Clay, Dodge, Houston, Nicollet, Olmsted, Polk, St. Louis and Stearns. The other 66 counties make up Greater Minnesota Rural.
5Five-year estimates of county level occupational employment by major group compared data for the 2005-2009 and the 2011-15 estimates.