by Nick Dobbins
March 2017
Monthly analysis is based on unadjusted employment data.
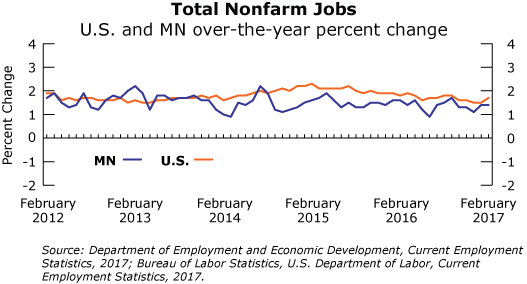
Employment in the Minneapolis-St. Paul-Bloomington MSA increased by 8,038 (0.4 percent) in February. Mining, Logging, and Construction added 2,826 jobs (4.3 percent), Educational and Health Services added 4,993 (1.5 percent), and Government employers added 3,508 (1.4 percent) as those three supersectors combined to account for most of the MSA’s monthly expansion. Notable supersectors to see negative growth included Leisure and Hospitality (down 2,098 jobs or 1.2 percent) and Trade, Transportation, and Utilities (down 1,504 jobs, 0.4 percent). On an annual basis the metro area added 31,224 jobs (1.6 percent). Four of the last five months showed an over-the-year change of 1.5 or 1.6 percent with December having just 1.2 percent growth. Only one supersector, Leisure and Hospitality, saw over-the-year job losses (down 3,532 or 2.1 percent). It marked the fifth straight month of negative job growth for the supersector with all of those losses driven by the Accommodation and Food Services sector, which was off by 4,582 jobs (3.2 percent), while the Arts, Entertainment, and Recreation sector added 1,050 jobs (3.6 percent). Annual growth in the metro area continues to be driven by Educational and Health Services, which added 11,368 jobs (3.6 percent). Mining, Logging, and Construction also saw notable growth, adding 2,767 jobs (4.2 percent), including 3,900 jobs in Specialty Trade Contractors as spring construction seemed to get an early start.
The Duluth-Superior MSA added 955 jobs (0.7 percent) in February. Government employers were the largest driver of growth, adding 789 jobs (2.9 percent). Educational and Health Services added 234 jobs (0.7 percent), and Manufacturing added 101 (1.4 percent). The biggest job losses, both proportionally and overall, came from the Trade, Transportation, and Utilities supersector, which shed 297 jobs (1.2 percent). Annually the Duluth MSA added 442 jobs (0.3 percent). The moderate growth belies the more dramatic movement in the supersector level. Mining, Logging, and Construction added 1,110 jobs (14.5 percent), the largest proportional and actual growth of any supersector in the area, while Leisure and Hospitality shed 673 jobs (5.1 percent). Other supersectors to see notable changes included Other Services (up 212 or 3.5 percent), Financial Services (up 169 or 3 percent), and Trade, Transportation, and Utilities (down 308 jobs or 1.2 percent).
Employment in the Rochester MSA was up slightly in February, adding 104 jobs (0.1 percent). Government employers added 139 jobs (1.1 percent) at the State and Local levels. Trade, Transportation, and Utilities lost jobs over the same period, off by 183 (1 percent) on the month. Annually the Rochester MSA added 928 jobs (0.8 percent). Educational and Health Services continued to drive the area’s employment growth, adding 1,356 jobs (2.9 percent). Notable areas of job loss included Professional and Business Services (down 228 or 4.1 percent) and Mining, Logging, and Construction (down 206 jobs or 5.5 percent).
Employment in the St. Cloud MSA was up by 806 (0.8 percent) in February. Steep losses in Trade, Transportation, and Utilities (down 418 jobs or 1.9 percent) were offset by gains of 410 jobs (2.7 percent) in Government employment and 420 jobs (1.9 percent) in Educational and Health Services, among others. Annually the St. Cloud MSA added 1,571 jobs (1.5 percent). This represented the strongest over-the-year growth of any MSA fully within the Minnesota borders. Educational and Health Services added 997 jobs (4.6 percent), and Mining, Logging, and Construction added 844 (16.6 percent). Notable declines appeared in the Leisure and Hospitality supersector, which lost 374 jobs (4.4 percent).
Employment in the Mankato-North Mankato MSA was up by 897 (1.6 percent) in February. Private sector employers added 394 jobs (0.8 percent) while Government employers added 503 jobs (4.9 percent). Goods Producers added 134 (1.4 percent), and Service Providers added 763 (1.6 percent). Annually the Mankato MSA lost 120 jobs (0.2 percent). It was once again the only MSA in the state to lose jobs on an over-the-year basis. Goods Producers showed strong growth, adding 243 jobs (2.6 percent), but that was overcome by the loss of 363 jobs among Service Providing industries. That loss was concentrated further among private sector service providers, who lost 547 jobs (1.4 percent).
Employment in the Fargo-Moorhead MSA was up by 1,095 (0.8 percent) in February. Government employment in particular spiked, adding 850 jobs (or 4.6 percent), the largest numerical and proportional increases of any supersector in the area. The gains were tempered by a loss of 334 jobs (1.1 percent) in Trade, Transportation, and Utilities and, more specifically, a loss of 356 jobs (2.2 percent) in Retail Trade. Annually the Fargo-Moorhead MSA added 2,528 jobs (1.8 percent). Only two supersectors shed jobs on the year: Leisure and Hospitality (down 30 jobs or 0.2 percent) and Trade, Transportation, and Utilities (down 26 jobs or 0.1 percent).
Employment in the Grand Forks-East Grand Forks MSA was up by 33 jobs (0.1 percent) in January. Government employment at least partially drove the growth (up 235 jobs or 1.6 percent). Annually the MSA added 1,440 jobs (2.6 percent), giving it the distinction of having both the lowest over-the-month growth and the highest over-the-year growth of any MSA in Minnesota. Mining, Logging, and Construction propelled the annual growth, adding 998 jobs (36.4 percent) on the year.
