by Amanda O'Connell
June 2024
Recent data releases provide valuable insights into the economy and labor market of Southeast Minnesota. The region saw a gain of nearly 3,500 jobs from 2022 to 2023, indicating a continuing recovery from the impacts of the pandemic. Moreover, job vacancies have returned to pre-pandemic levels, signaling a normalization of the job market in the area. This article aims to explore these trends in greater detail, offering insights from the Quarterly Census of Employment & Wages (QCEW) and the Job Vacancy Survey.
Job growth in Southeast Minnesota has shown positive trends over the past year, as detailed in the latest data from QCEW. In 2023, the region provided 243,667 jobs across 13,569 employer establishments, reflecting its ongoing recovery efforts from the economic challenges of the Pandemic Recession. The total payroll for the region reached an impressive $15.5 billion, with an average annual wage of $63,388, marking an increase of $2,209 from the previous year, and was the second highest in the six planning regions in the state. However, average annual wages in Southeast Minnesota were about $8,160 lower than the average annual wage statewide.
From 2022 to 2023, there was an increase of 248 employer establishments and 3,499 jobs. Among 20 industry sectors, 16 saw a growth in the number of establishments over the year. The sectors with the most significant growth in establishments was Health Care & Social Assistance (+83 establishments), followed by Accommodation & Food Services (+28 establishments), and Professional, Scientific, & Technical Services (+21 establishments). Conversely, four industries saw a decline in the number of establishments: Transportation & Warehousing (-5 establishments), Public Administration (-2 establishments), and Manufacturing and Utilities, each decreasing by one establishment.
Similar to the increase in establishments, there were widespread job gains from 2022 to 2023. The industry with the largest numeric increase in jobs was Health Care & Social Assistance (+916 jobs), followed by Accommodation & Food Services (+866 jobs). Manufacturing and Arts, Entertainment & Recreation both added about 320 jobs within the same time period. The industries with the largest losses in employment were Finance & Insurance (-87 jobs), Administrative & Support & Waste Management Services (-86 jobs), Transportation & Warehousing (-82 jobs), and Information (-51 jobs).
The three largest employing industries in Southeast Minnesota include Health Care & Social Assistance, Manufacturing, and Retail Trade, which combined account for 53% of total employment in the region. Health Care & Social Assistance had 66,409 jobs and 1,982 firms, accounting for 27.3% of total employment in the area. This industry has recovered all jobs since 2019 and has added jobs within the past year. The largest subsectors include Ambulatory Health Care Services, providing 33,770 jobs with 500 firms, followed by Hospitals (15,509 jobs and 23 firms), Nursing & Residential Care (10,613 jobs and 288 firms), and Social Assistance (6,516 jobs and 1,172 firms).
The next largest industry in Southeast Minnesota is Manufacturing, with 36,380 jobs and 662 firms. Although the industry has lost 2,354 jobs since 2019, it gained 321 jobs within the past year. The largest subsectors include Food Manufacturing (10,352 jobs and 104 firms), Machinery Manufacturing (4,403 jobs and 69 firms), and Computer & Electronic Product Manufacturing (4,306 firms and 28 firms).
The third largest industry in Southeast Minnesota is Retail Trade, with 26,347 jobs and 1,594 firms. The industry has recovered all jobs since 2019 and added 107 jobs within the past year. The largest subsectors include General Merchandise Retailers (5,841 jobs and 114 firms), Food & Beverage Stores (5,196 jobs and 215 firms), and Gasoline Stations & Fuel Dealers (3,958 jobs and 221 firms).
| Table 1. Southeast Minnesota Industry Employment Statistics, 2023 | ||||||||
|---|---|---|---|---|---|---|---|---|
| Industry | 2023 Annual Data | 2022-2023 | 2019-2023 | |||||
| Number
of Jobs |
Number of
Establish- ments |
Total Payroll | Avg.
Annual Wage |
Change
in Jobs |
Percent
Change |
Change
in Jobs |
Percent
Change |
|
| Total, All Industries | 243,667 | 13,569 | $15,455,922,983 | $63,388 | +3,499 | +1.5% | -3,141 | -1.3% |
| Health Care & Social Assistance | 66,409 | 1,982 | $5,542,751,721 | $83,460 | +916 | +1.4% | +151 | +0.2% |
| Manufacturing | 36,380 | 662 | $2,627,236,225 | $72,228 | +321 | +0.9% | -2,354 | -6.1% |
| Retail Trade | 26,347 | 1,594 | $909,691,381 | $34,528 | +107 | +0.4% | +210 | +0.8% |
| Accommodation & Food Services | 19,911 | 1,174 | $465,509,526 | $23,348 | +866 | +4.5% | -159 | -0.8% |
| Educational Services | 19,683 | 280 | $1,050,938,340 | $53,456 | +248 | +1.3% | -13 | -0.1% |
| Public Administration | 11,225 | 363 | $729,969,449 | $65,052 | +270 | +2.5% | +33 | +0.3% |
| Construction | 10,150 | 1,495 | $723,169,007 | $71,084 | +198 | +2.0% | +165 | +1.7% |
| Transportation & Warehousing | 7,828 | 608 | $449,595,719 | $57,408 | -82 | -1.0% | +70 | +0.9% |
| Admin. Support & Waste Mgmt. Svcs. | 7,294 | 537 | $416,260,797 | $57,096 | -86 | -1.2% | -971 | -11.7% |
| Wholesale Trade | 6,670 | 505 | $543,557,320 | $81,484 | +81 | +1.2% | -22 | -0.3% |
| Other Services | 6,635 | 1,401 | $239,163,715 | $36,036 | +242 | +3.8% | +73 | +1.1% |
| Management of Companies | 4,497 | 59 | $486,445,327 | $108,264 | +201 | +4.7% | +1,581 | +54.2% |
| Arts, Entertainment, & Recreation | 4,226 | 283 | $119,174,029 | $28,288 | +320 | +8.2% | +127 | +3.1% |
| Finance & Insurance | 4,078 | 691 | $326,216,425 | $79,976 | -87 | -2.1% | -1,725 | -29.7% |
| Professional & Technical Services | 3,701 | 835 | $269,366,760 | $72,852 | +5 | +0.1% | +325 | +9.6% |
| Agriculture, Forestry, Fish & Hunting | 3,200 | 427 | $142,544,701 | $44,512 | -38 | -1.2% | +17 | +0.5% |
| Information | 2,434 | 215 | $142,176,821 | $58,396 | -51 | -2.1% | -700 | -22.3% |
| Real Estate & Rental & Leasing | 1,405 | 388 | $63,905,995 | $45,500 | +14 | +1.0% | -52 | -3.6% |
| Utilities | 1,390 | 50 | $192,659,377 | $138,632 | +43 | +3.2% | +65 | +4.9% |
| Mining | 200 | 22 | $15,590,348 | $75,816 | +15 | +8.1% | +39 | +24.2% |
| Source: Quarterly Census of Employment & Wages | ||||||||
Of the 11 counties in Southeast Minnesota, Olmsted County was home to the most jobs (102,037 jobs) and the most firms (4,034) in the region. Olmsted, along with Fillmore and Mower County, have recovered all jobs that were lost since 2019. The counties farthest from recovery include Steele, Wabasha, and Dodge County. Over the past year, 9 of the 11 counties gained jobs, with the highest numeric increase in Olmsted (+1,493 jobs), Mower (+574 jobs), Rice (+451 jobs) and Goodhue (+438 jobs). Fillmore and Steele County both lost jobs from 2022 to 2023 (see Table 2).
| Table 2. Southeast Minnesota Industry Employment, 2023 | 2022-2023 | 2019-2023 | ||||||
|---|---|---|---|---|---|---|---|---|
| Geography | Number
of Jobs |
Number of
Establish- ments |
Total Payroll | Average
Annual Wage |
Change
in Jobs |
Percent
Change |
Change
in Jobs |
Percent
Change |
| Southeast Minnesota | 243,667 | 13,569 | $15,455,922,983 | $63,388 | +3,499 | +1.5% | -3,141 | -1.3% |
| Dodge County | 5,827 | 495 | $349,522,803 | $59,956 | +72 | +1.3% | -219 | -3.6% |
| Fillmore County | 6,260 | 783 | $267,283,662 | $42,692 | -21 | -0.3% | +150 | +2.5% |
| Freeborn County | 11,780 | 828 | $598,003,313 | $50,752 | +78 | +0.7% | -308 | -2.5% |
| Goodhue County | 21,126 | 1,360 | $1,243,810,397 | $58,864 | +438 | +2.1% | -532 | -2.5% |
| Houston County | 5,084 | 458 | $225,924,804 | $44,408 | +103 | +2.1% | -110 | -2.1% |
| Mower County | 16,731 | 887 | $970,532,535 | $57,980 | +574 | +3.6% | +410 | +2.5% |
| Olmsted County | 102,037 | 4,034 | $7,732,823,623 | $75,764 | +1,493 | +1.5% | +1,312 | +1.3% |
| Rice County | 25,531 | 1,762 | $1,440,715,729 | $56,368 | +451 | +1.8% | -50 | -0.2% |
| Steele County | 18,879 | 1,135 | $1,108,586,860 | $58,708 | -81 | -0.4% | -2,900 | -13.3% |
| Wabasha County | 6,510 | 595 | $296,726,929 | $45,604 | +96 | +1.5% | -277 | -4.1% |
| Winona County | 23,900 | 1,234 | $1,221,992,328 | $51,116 | +295 | +1.2% | -617 | -2.5% |
| Source: Quarterly Census of Employment & Wages | ||||||||
Recent data from the Job Vacancy Survey indicates that in 2023, Southeast Minnesota had 13,711 job vacancies with a median hourly wage of $18.22, an increase of over $2 compared to the past year. Of these vacancies, 27% were part-time positions, decreasing from 41% in the previous year. Additionally, just 6% of the vacancies were temporary or seasonal, suggesting a preference among employers for permanent staff.

Furthermore, one-third of the jobs required postsecondary education and 36% required one or more years of work experience. Median hourly wage offers ranged from $58 for Legal occupations like Lawyers to $14 for Sales & Related occupations such as Cashiers or Retail Salespersons.
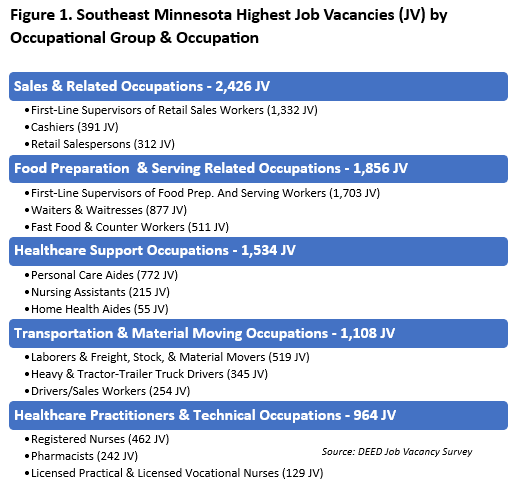
Of the 13,711 job vacancies in the region, the top five occupational groups—Sales & Related, Food Preparation & Serving Related, Healthcare Support, Transportation & Material Moving, and Healthcare Practitioners & Technical Occupations—comprised 57.5% of the total vacancies. Figure 1 provides a detailed breakdown of these top five occupational groups, highlighting occupations with the highest number of vacancies within each group.
| Table 3. Job Vacancies in Southeast Minnesota, 2023 | |||||||
|---|---|---|---|---|---|---|---|
| Occupational Group | Number
of Job Vacancies |
Median
Wage Offer |
Percent
Part-Time |
Requiring
Postsecondary Education |
Requiring
1 or More Years of Work Experience |
Requiring
Certificate or License |
Job
Vacancy Rate |
| Total, All Occupations | 13,711 | $18.22 | 27% | 32% | 36% | 49% | 5.7% |
| Sales & Related | 2,426 | $13.96 | 55% | 12% | 24% | 17% | 13.4% |
| Food Preparation & Serving Related | 1,856 | $14.91 | 40% | 1% | 21% | 5% | 9.7% |
| Healthcare Support | 1,534 | $16.49 | 30% | 17% | 7% | 94% | 10.9% |
| Transportation & Material Moving | 1,108 | $20.14 | 15% | 5% | 40% | 75% | 5.9% |
| Healthcare Practitioners & Technical | 964 | $33.92 | 18% | 93% | 66% | 97% | 3.1% |
| Installation, Maintenance, & Repair | 732 | $21.35 | 5% | 32% | 45% | 28% | 8.8% |
| Production | 690 | $19.95 | 10% | 10% | 37% | 21% | 3.1% |
| Community & Social Service | 608 | $21.43 | 8% | 96% | 63% | 92% | 13.6% |
| Office & Administrative Support | 548 | $18.66 | 18% | 17% | 46% | 31% | 2.0% |
| Business & Financial Operations | 467 | $25.49 | 2% | 85% | 90% | 75% | 5.0% |
| Personal Care & Service | 455 | $14.98 | 24% | 54% | 19% | 70% | 10.2% |
| Educational Instruction & Library | 418 | $19.67 | 27% | 71% | 29% | 79% | 2.9% |
| Building & Grounds Cleaning & Maint. | 314 | $19.06 | 12% | 0% | 7% | 17% | 5.0% |
| Architecture & Engineering | 297 | $27.42 | 1% | 58% | 94% | 51% | 8.8% |
| Management | 212 | $37.73 | 15% | 89% | 98% | 35% | 1.7% |
| Protective Service | 192 | $16.29 | 45% | 21% | 17% | 76% | 5.5% |
| Life, Physical, & Social Science | 171 | $30.13 | 1% | 94% | 86% | 87% | 6.8% |
| Construction & Extraction | 160 | $23.33 | 0% | 17% | 55% | 79% | 1.9% |
| Internships | 159 | $17.46 | 22% | 94% | 4% | 20% | N/A |
| Arts, Design, Entertainment & Media | 138 | $19.74 | 58% | 29% | 52% | 61% | 6.5% |
| Computer & Mathematical | 97 | $37.67 | 4% | 77% | 96% | 63% | 2.3% |
| Apprenticeships | 77 | $19.18 | 15% | 17% | 69% | 89% | N/A |
| Farming, Fishing, & Forestry | 70 | $18.01 | 5% | 0% | 3% | 4% | 16.7% |
| Legal | 19 | $58.31 | 0% | 100% | 94% | 100% | 2.5% |
| Source: DEED Job Vacancy Survey | |||||||
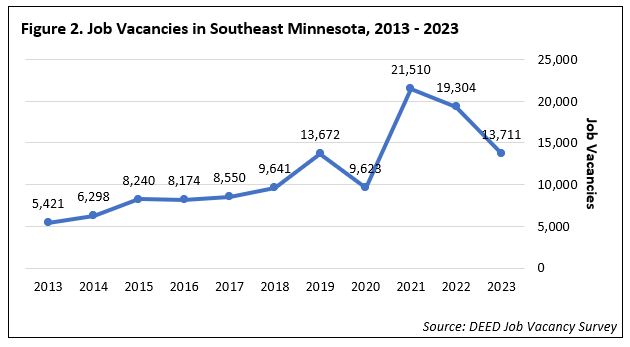
The job vacancies in Southeast Minnesota indicate a recovery to pre-pandemic levels. There was a notable decline in 2020, where vacancies dropped to 9,623 due to the economic disruptions caused by the COVID-19 pandemic. Employers in the region then reported record high vacancy levels in 2021 and 2022, but by 2023, vacancies aligned closely with the 2019 figures, which stood at 13,672. The trend suggests a return to normalcy of hiring practices in Southeast Minnesota (Figure 2).

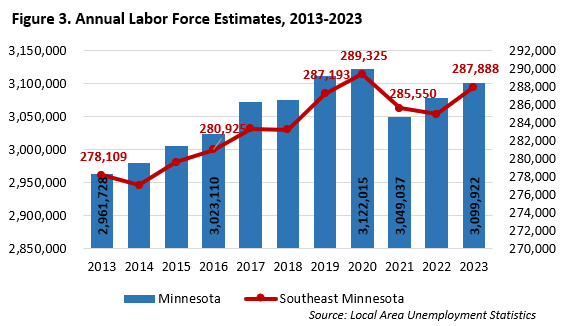
From 2013 to 2023, Southeast Minnesota experienced labor force growth, mirroring broader trends observed in the state of Minnesota. In 2013, Southeast Minnesota had a labor force of 278,109 people, while the state had 2,961,728 workers. By 2023, these numbers had enlarged to 287,888 for Southeast Minnesota and 3,099,922 workers for the state, reflecting growth over the decade.

Southeast Minnesota saw an overall rise in its labor force from 279,552 in 2015 to 289,325 workers in 2020, despite some fluctuations. The pandemic in 2020 caused a decline to 284,871 in 2022, but the labor force rebounded to 287,888 in 2023, surpassing its 2019 pre-pandemic level of 287,193 workers.
Recent estimates from 2023 to the first quarter of 2024 indicate that Southeast Minnesota's labor force has grown. The labor force expanded from 285,204 in January 2023 to 290,449 by March 2024, an increase of 5,245 workers. Interestingly, the number of unemployed people decreased by 869, while the number of employed individuals jumped by 6,114, leading to lower unemployment rates.
Southeast Minnesota's labor market demonstrates ongoing recovery and growth, as highlighted by the increase in jobs and establishments, the decrease in job vacancies, and the increase of the labor force within the past year. The region's key industries, particularly Health Care & Social Assistance, Manufacturing and Retail Trade, have shown growth, contributing significantly to the local economy.
Despite setbacks during the pandemic, the labor force has shown a positive trajectory, with significant growth observed in recent months. The decrease in the number of unemployed people and the increase in the number of employed people underscore the region's success in effectively reintegrating individuals into the workforce. Overall, these trends reflect a resilient and strong economy in Southeast Minnesota.