 Central Minnesota is a manufacturing stronghold, with several global manufacturing firms operating there.
The region is especially well known for its expertise in food processing, printing, furniture manufacturing, appliances, machinery and heavy equipment manufacturing.
View our latest blogs on CareerForce. Want the freshest data delivered by email? Subscribe to our regional newsletters.
8/28/2017 10:09:32 AM
Luke Greiner
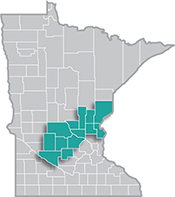
 Every year DEED's Regional Analysis and Outreach unit updates the comprehensive regional economic and demographic profiles for every region in the state, including Central Minnesota. Although the profiles are incredibly exciting to read, not everyone has time to breeze through 16 pages. So we've done our best to create a regional highlight reel for Central Minnesota.
As the region's population continues to grow older, it also started to see declines, losing 361 people in the past year and 1,813 people since 2010. The growth from older residents was not enough to offset the losses in younger cohorts. Revised population projections from the Minnesota State Demographic Center show more of the same in the future, with the region now expected to see a -3.1 percent decline in population from 2020 to 2040, reversing a projected population increase into a decrease. The region's racial and ethnic composition remained largely unchanged from previous estimates, though there was a slightly larger number of Hispanic or Latino people, but a small loss of Black or African American residents.
Keeping up with a pattern of ebb and flow, the region's labor force shrunk in 2016 after peaking just a year prior (Figure 1). Labor force projections were also revised, and the new Region 6E profile highlights a decline of more than 3,200 available workers by 2030. Although the labor force declined in the last year, the annual unemployment rate ticked up from 4.1 percent in 2015 to 4.4 percent in 2016.

On that same note, the median hourly wage across all occupations increased to $17.07, although it moved down in rankings, from the fifth to the seventh highest of the 13 economic development regions in the state. This could be a reflection of the -1.2 percent decrease in jobs in the region from 2015 to 2016. The largest decline was in manufacturing, an industry that has average annual wages nearly $15,000 higher than the average for all industries. However, the agriculture and accommodation and food services industries also saw declines in the past year. The largest gains came from the health care and social assistance industry, which added 91 net new jobs since 2015. Like covered employment, self-employment also saw a continuing downward trend, dipping to just under 8,100 nonemployer establishments in the region in 2015.
| Table 1. Race and Hispanic Origin, 2015 | |||||
|---|---|---|---|---|---|
|
Region 7W |
Minnesota |
||||
|
Number |
Percent |
Change from 2000-2015 |
Percent |
Change from 2000-2015 |
|
|
Total |
410,908 |
100.0% |
+27.7% |
100.0% |
+10.2% |
|
White |
382,556 |
93.1% |
+23.0% |
84.8% |
+4.4% |
|
Black or African American |
9,717 |
2.4% |
+349.7% |
5.5% |
+74.2% |
|
American Indian & Alaska Native |
1,715 |
0.4% |
+60.7% |
1.0% |
+2.9% |
|
Asian & Other Pac. Islander |
5,781 |
1.4% |
+72.7% |
4.5% |
+68.6% |
|
Some Other Race |
3,408 |
0.8% |
+152.3% |
1.5% |
+24.7% |
|
Two or More Races |
7,731 |
1.9% |
+182.1% |
2.7% |
+74.3% |
|
Hispanic or Latino origin |
10,962 |
2.7% |
+185.7% |
5.0% |
+89.0% |
|
Source: U.S. Census Bureau, 2011-2015 American Community Survey |
|||||
Unlike Region 6E, Region 7W saw a population increase of more than 4,250 new residents in the past year and nearly 19,500 people since 2010, making it the fastest growing region in the state. The gains occurred in all four counties. Population projections were revised downward for Region 7W, but the trends remain largely positive and the region is expected to reach 457,465 residents by 2040. Less diverse than the state as a whole, Central Minnesota's racial distribution remained largely unchanged over the past year, with a 0.1 percent decrease in Whites to 93.1 percent, and increases of the same magnitude among the minority races and ethnicities from 2015 to 2016. However, all race groups were growing rapidly in the region over time (Table 1).
Because of the population growth, Region 7W's labor force continues to grow, albeit more slowly, increasing by just over 2,100 workers from 2015 to 2016. The projected labor force change to 2030 reflects the slower population projections as well, and was revised to just 3,400 net new workers, a 1.4 percent increase compared to previous estimates of 6 percent growth through 2025. Despite the growth, Region 7W's unemployment rate ticked up from 3.8 percent in 2015 to 4 percent in 2016.
The median hourly wage across all occupations increased to $17.48 in 2016 from $16.92 a year prior, but the region's ranking in the state fell from fourth highest to fifth out of 13. Employment growth was slightly slower than the year prior, with employers edging payrolls up by 1.5 percent since 2015, to 170,160 total jobs in 2016. Average annual wages across all industries bumped up nearly $1,100 from 2015 to 2016. Nearly identical to last year, the region saw the biggest job gains in manufacturing, retail trade, accommodation and food services, health care and social assistance, and construction. Thanks to the population and job growth, the number of nonemployers in the region also increased, continuing last year's trend.
Region 7E saw a slight 0.6 percent population increase from 2015 to 2016, welcoming 927 net new residents. However, only Chisago, Isanti, and Mille Lacs counties gained residents, while both Pine and Kanabec counties saw population declines. Only Chisago and Isanti experienced population increases from 2010 to 2016, with the region gaining just 554 people during the past 6 years.
Likewise, revisions to population projections through 2040 drastically changed the previous estimates, scaling the region's growth back to approximately 167,000 residents by 2040, instead of reaching 200,000 (Figure 2). Racial diversity remained nearly unchanged, with 94.3 percent of the population being White in 2016, and no other race or minority group comprising more than 2 percent of the population.

Region 7E's labor force estimates climbed back to just over 85,500 workers in 2016 from 84,500 workers one year prior, but the region peaked at 87,166 workers in 2010. Moving forward, future estimates show a reduction of 3,200 fewer workers by 2030, a 3.8 percent decline. After a half point drop in the unemployment rate last year, the rate moved back up to 5.2 percent, finishing 1.3 percent above the state rate.
The median hourly wage for all occupations in the region increased 78 cents to $17.78 in 2017, and continues to be the third highest of the 13 EDRs in the state. Although employment increased in both 2016 and 2015, the increase from 2015 to 2016 was only about half as fast as it was the year prior. Employers in Mille Lacs and Isanti counties continued to shed workers, with jobs declining by more than 1 percent. In contrast, both Chisago and Kanabec counties had huge job gains, outpacing the state's rate of growth from 2015 to 2016.
The largest job gains in the region over the past year were found in health care and social assistance, construction, and professional and technical services, though much of that was due to a reclassification from manufacturing. Over the past five years, manufacturing saw the biggest job expansion, adding more than 1,000 net new jobs.
Contact Luke Greiner at 320-308-5378 or email Luke.Greiner@state.mn.us.
