skip to content
Primary navigation

Metro Region

twin-cities-mapThe Minneapolis-St. Paul metropolitan area is a national leader in finance, advanced manufacturing, agriculture and retailing.

Medical devices, electronics and processed foods are strong suits recognized globally.

Want the freshest data delivered by email? Subscribe to our regional newsletters.

Manufacturing a Closer Look

8/17/2015 2:23:55 PM

Tim O'Neill

The Department of Employment and Economic Development's (DEED) most recent Employment Review publication highlighted manufacturing in the Twin Cities metropolitan area. Some key takeaways:

  • Manufacturing makes up the region's second largest-employing industry sector, with 165,300 jobs
  • At $68,850, the average annual wage for manufacturing workers is 23 percent higher than the average annual wage for all industries
  • Computer and Electronic Product Manufacturing, Fabricated Metal Product Manufacturing, Miscellaneous Manufacturing, and Machinery Manufacturing make up the largest-employing subsectors
  • The Great Recession hit manufacturing employment hard, but jobs are steadily coming back to the Twin Cities

We can break up the data for a much more complete picture of manufacturing in the Twin Cities. For job seekers, employers, government agencies, students, and others interested in learning about manufacturing in the region, there are a number of resources that provide a detailed picture:

  • Monthly employment updates - check out DEED's Current Employment Statistics (CES) tool to get the latest job numbers, trends, earnings, and hours worked per week. For example, as of June 2015, there were 194,792 manufacturing jobs, making up approximately 10 percent of the Minneapolis-St. Paul Metropolitan Statistical Area's total employment. One could also find that manufacturing has the highest number of hours worked per week, at 41.3 hours.
  • Local analysis - highlighted in previous blog posts, DEED's Quarterly Census of Employment and Wages (QCEW) program allows users to study manufacturing employment at the state, regional, county, and city levels. Additionally, one can look up the number of manufacturing establishments, number of jobs, total payroll, and average weekly wages. The QCEW tool is also great for looking up historical trends. Table 1 provides a snapshot of manufacturing statistics for the Seven-County Metro Area.
  • Current Vacancies - DEED's Job Vacancy Survey reveals the number of vacancies by industry and occupation, updated every second and fourth quarter. Beyond simple vacancy numbers, this tool also digs into vacancy characteristics. Within the Seven-County Metro, for example, there were 5,233 manufacturing vacancies during the fourth quarter, 2014. This represented an 80 percent increase in manufacturing vacancies over the previous year. Through this tool, one would also see that median hourly wage offers for jobs in manufacturing are among the highest across all industries, at $23.84.
  • Employment demographics - also highlighted in previous blog posts, the U.S. Census Bureau's Quarterly Workforce Indicators (QWI) tool allows users to study manufacturing employment by age, sex, education, and race/ethnicity. Using this tool, one could discover that nearly one-fourth of manufacturing workers in the Seven-County Metro are 55 years of age or older.

There are several resources and tools beyond those listed above. Unemployment Insurance Statistics, County Business Patterns, and Nonemployer Statistics are just a few of these resources. Check out future blogs to learn more about these resources and how they can be used to better understand the Twin Cities labor market.
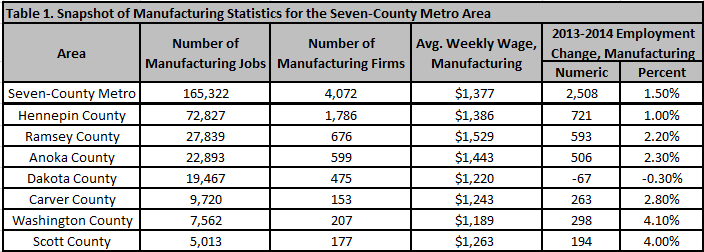
Snapshot of Manufacturing stats for the seven-county metro area

For More Information

Contact Tim O'Neill at 651-259-7401.

back to top