 The Minneapolis-St. Paul metropolitan area is a national leader in finance, advanced manufacturing, agriculture and retailing.
Medical devices, electronics and processed foods are strong suits recognized globally.
Want the freshest data delivered by email? Subscribe to our regional newsletters.
2/29/2016 2:23:55 PM
Tim O'Neill
Wages can be a sensitive topic, but it is the crux to where labor supply and demand meet. This is especially true in tight labor market conditions, where employers are looking to capture and retain their workforce needs. When analyzing any labor market area, wages will almost certainly come up.
The go-to resource for wage detail is the Occupational Employment Statistics (OES) tool. Partnering with the U.S. Bureau of Labor Statistics, DEED surveys approximately 6,000 employers twice per year. The resulting data provides employment and wage statistics for over 800 occupations.
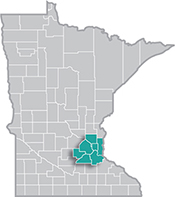
Along with average and median wage estimates, the OES tool supplies 10th, 25th, 75th, and 90th percentile wages, which can provide a guideline for setting entry-level or starting wages to top-end salaries. As of the most recent survey, there are an estimated 1.7 million jobs in the seven-county Metro, with an overall median hourly wage of $20.49.
This data can be compared to DEED’s Cost of Living Calculator, which provides an estimate of the basic-needs budget for a typical family of three. In the Twin Cities metro area, with one full-time adult worker and one part-time adult worker in the family, the cost of living is $55,896, which translates to an hourly wage of $17.92 for each worker. As such, the region’s overall median wage of $20.49 is more than enough to meet basic needs.
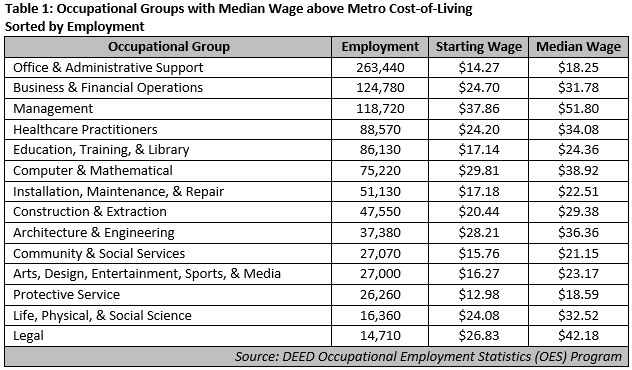
However, OES data show that many occupational groups do not meet the $17.92 threshold. Table 1 lists those occupational groups with median wages high enough to surpass the Metro’s basic-needs hourly earnings rate of $17.92. These occupations account for nearly 60 percent of the region’s total employment.

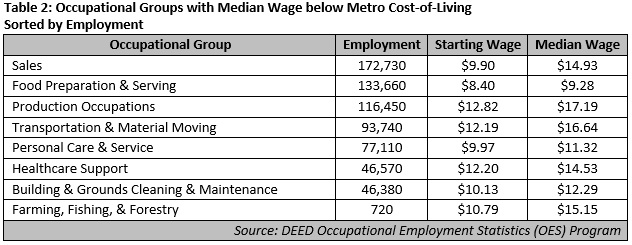
Table 2 lists those occupational groups whose median wages do not meet the basic-needs threshold. Including occupations within Sales, Food Preparation and Serving, and Healthcare Support, these groups account for over 40 percent of the Metro's total employment, or 687,000 jobs.

Stay tuned for more in-depth wage analysis of the Metro Area.
Contact Tim O'Neill at 651-259-7401.