 The Minneapolis-St. Paul metropolitan area is a national leader in finance, advanced manufacturing, agriculture and retailing.
Medical devices, electronics and processed foods are strong suits recognized globally.
Want the freshest data delivered by email? Subscribe to our regional newsletters.
11/29/2017 10:09:32 AM
Tim O'Neill
The Minnesota Department of Employment and Economic Development (DEED) has released a new data tool: the Quarterly Employment Demographics (QED). The QED data tool provides job distribution statistics, median hourly wage, and median hours per quarter broken down by gender and age, available by industry and geography.
There are two main types of analysis you can accomplish with QED:
1. You can study employment, wages, and hours worked by age. For example, are some industry sectors older than others? Are some industries aging faster in recent years? Is the aging more pronounced in certain regions or counties of the state?
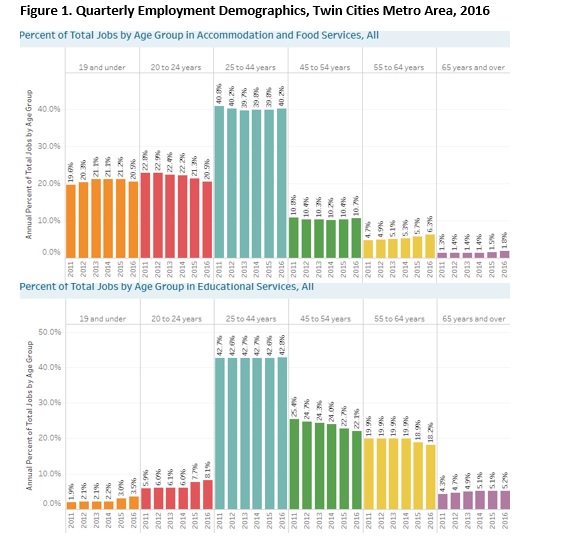
Using QED data to analyze the Accommodation and Food Services and Educational Services provides for a simple, but effective realization of this data. For example, in the Twin Cities Metro Area, workers 24 years and younger made up 41 percent of total employment within Accommodation and Food Services. Such workers only made up 12 percent of total employment within Educational Services. This makes sense, considering the educational requirements for select occupations within these industries, and the time needed to obtain higher education for jobs in Educational Services (Figure 1).

Other industries with younger workforces in the Twin Cities include Retail Trade and Arts, Entertainment, and Recreation, while other industries with higher percentages of older workers include Transportation and Warehousing, Utilities, Mining, and Public Administration.
2. You can study employment, wages, and hours worked by gender. What industries employ more women? What are the gender differences in earnings and hours worked? In what regions of the state are these difference more acute?
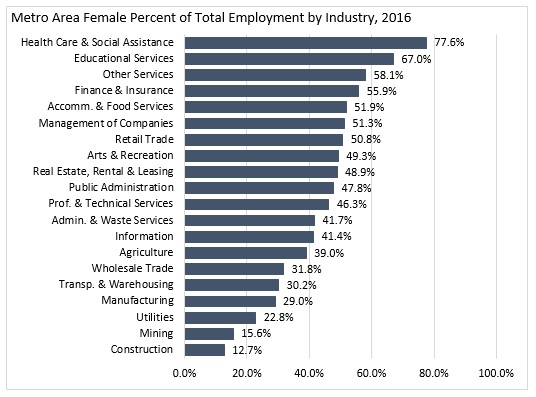
Within the Seven-County Metro Area, over three-quarters of Health Care and Social Assistance’s total employment is women. As such, this industry has the highest share of female employment of the major industry sectors. Construction, with about one-in-eight workers being women, has the lowest share of female employment of the major industry sectors (Figure 2). Overall, QED shows that women comprise just over half of the Metro Area’s total workforce (50.3%).

Digging into the data a bit more, one could discover that the median number of hours worked per week for women across all industries was 33, while the median number of hours worked per week for men was 40. Finally, in terms of wages, women were earning a median hourly wage of $19.10 across all industries. This was 85 percent of the median hourly wage earned by men across all industries, at $22.48
All of this data has become available due to a data-sharing agreement between DEED and the Minnesota Department of Public Safety (DPS). This is just a sample of how you can use the QED tool to understand the labor market in greater detail. To get started on realizing the potential of the QED tool, check out these recent research articles.
Contact Tim O'Neill at 651-259-7401.