 The Minneapolis-St. Paul metropolitan area is a national leader in finance, advanced manufacturing, agriculture and retailing.
Medical devices, electronics and processed foods are strong suits recognized globally.
Want the freshest data delivered by email? Subscribe to our regional newsletters.
12/28/2017 10:09:32 AM
Tim O'Neill
Winter has arrived to the state of Minnesota. As I write, the current temperature in St. Paul is a balmy 5 degrees Fahrenheit. Of course, many would not consider such a temperature to be balmy, wondering how anybody could care to venture outside. Some Minnesotans, dubbed "snowbirds," even leave for warmer climates to the south during winter. In a similar fashion, winter in Minnesota affects industry employment across the state, too.
One quick way to measure seasonal variation in industry employment is with the Bureau of Labor Statistic's Current Employment Statistics (CES) data. Updated monthly, CES allows for frequent and timely analysis. To look at seasonal changes, we can compare 1st quarter employment (Q1 includes the winter months of January, February, and March) with 3rd quarter employment (Q3 includes the summer months of July, August, and September) to determine how much of an impact winter has on total employment levels in each of the 50 states.

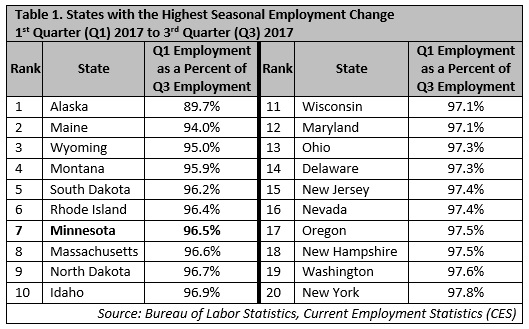
Using this methodology, Minnesota comes in 7th for the impact winter had on total employment variation in 2017. More specifically, the average employment count in Minnesota during Q1 2017 made up 96.5 percent of the total employment in the state during Q3 of that same year (Table 1). While that may not seem like a large seasonal shift at first glance, that represents nearly 104,000 fewer jobs between Q1 and Q3.
With the Q1 count of jobs making up 96.2 percent of its Q3 employment, the Twin Cities Metro Area is just a bit more seasonal in nature than Minnesota as a whole. As such, Minneapolis-St. Paul MSA employers shed over 76,200 jobs between the first and third quarters of 2017.
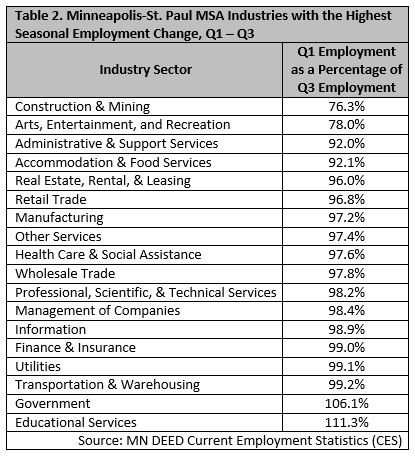
So which employers are affected by winter the most? Using the same methodology (comparing Q1 employment to Q3 employment), Construction and Mining have the largest seasonal variation in the Minneapolis-St. Paul Metropolitan Statistical Area (MSA). Over the past five years, between 2012 and 2017, Construction and Mining employment in Q1 averaged only 76.3 percent of Q3 employment each year. Other highly seasonal industries include Arts, Entertainment, and Recreation; Administrative and Support Services; Accommodation and Food Services; and Real Estate, Rental, and Leasing.
While a host of conditions may lead to employment variation among employers from one quarter to the next, there is no denying that employment levels in Minnesota and the Twin Cities Metro drop along with the temperature for nearly every industry sector (Table 2).

Contact Tim O'Neill at 651-259-7401.