 The Minneapolis-St. Paul metropolitan area is a national leader in finance, advanced manufacturing, agriculture and retailing.
Medical devices, electronics and processed foods are strong suits recognized globally.
Want the freshest data delivered by email? Subscribe to our regional newsletters.
1/30/2018 10:09:32 AM
Tim O'Neill
It's no surprise that the Twin Cities Metro Area is experiencing a tight labor market. The unemployment rate, at 2.3 percent, is at its lowest point since December of 1999. Job vacancies, at approximately 73,900, are at their highest point since 2001, when DEED began its Job Vacancy Survey (JVS). Through the second quarter of 2017, there were an estimated 55,900 unemployed persons in the Metro Area for the 73,900 vacancies. As such, there was less than one unemployed person for every job vacancy. Hence, the tight labor market. Check out DEED's website for more on the region's tight labor market, and creative solutions for aligning workers and job vacancies.
One major consequence of a tight labor market: wage growth. Recently, Minnesota Economic Trends highlighted wage growth in the state. According to the article, "Average weekly wages as measured by the Quarterly Census of Employment and Wages (QCEW) has been on a steady upswing for four years, including the first half of 2017." Further, the article states, "Real (inflation-adjusted) average wages rose 7.2 percent between the second quarters of 2013 and 2017, compared with 2.6 percent over the previous 10 years, which included a period of declining wages during the recession."
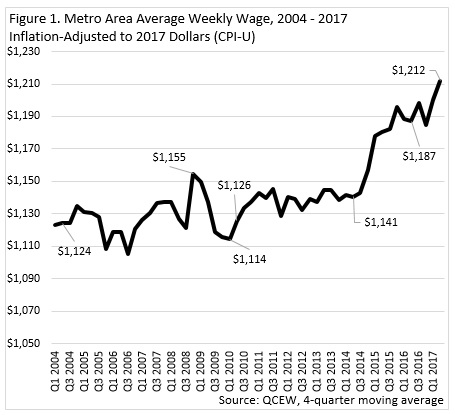
Recently, wages have also been on the rise in the Twin Cities Metro Area. Between the second quarters of 2014 and 2017, average weekly wages rose by 6.2 percent (inflation-adjusted). This was after a decade of little to no growth, with average weekly wages only increasing by 1.5 percent between the second quarters of 2004 and 2014. This included a period between quarter four, 2008, and quarter one, 2010, when wages declined by 3.5 percent (Figure 1).

Which industries experienced the most wage growth over the year? Between the second quarters of 2016 and 2017, wages increased in 17 of the 20 main industry sectors, most notably in wholesale trade, agriculture, administrative support and waste management services, and finance and insurance. For reference, the average weekly wage for the total of all industries increased by about 4 percent over the year. Average weekly wages rose in 19 of 20 industries since the second quarter of 2017, with only educational services seeing a decline. To analyze these industry employment and wage trends in more detail, visit DEED's QCEW tool.
DEED's Job Vacancy Survey tool also allows analysis of wage trends over time, for both industries and occupations. When analyzing the change in median hourly wage offers between the second quarters of 2014 and 2017, the occupational groups witnessing the largest growth include Food Preparation and Serving, Legal, Sales and Related, Office and Administrative Support, Computer and Mathematical, and Building and Grounds Cleaning and Maintenance occupations.
For a look at current wages by occupation and occupational group, visit DEED's Occupational Employment Statistics tool.
Contact Tim O'Neill at 651-259-7401.