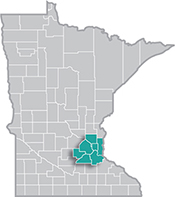
 The Minneapolis-St. Paul metropolitan area is a national leader in finance, advanced manufacturing, agriculture and retailing.
Medical devices, electronics and processed foods are strong suits recognized globally.
Want the freshest data delivered by email? Subscribe to our regional newsletters.
7/26/2018 3:00:00 PM
Tim O'Neill
The unemployment rate is one of the most popular pieces of information released from DEED’s Labor Market Information Office. You might hear what the unemployment rate is from your local news station, read about it in the newspaper, or see an official release of such data from DEED and the Bureau of Labor Statistics (BLS). If you are an employer, you are probably keeping an eye on the unemployment rate in different areas to get a sense of where available workers may be. If you are a job seeker, you may notice more opportunities for work as the unemployment rate drops. Of course, there are a lot of complexities around the unemployment rate and the labor market in general that a simple number will not reveal. This blog post will break down the unemployment rate in the Twin Cities, with more to come in a future Employment Review – stay tuned for that.
As of June 2018, the unemployment rate in the seven-county Twin Cities Metro Area was 2.8 percent. What exactly does this mean? First, we need to understand a few other terms, including employment, unemployment, and the labor force.
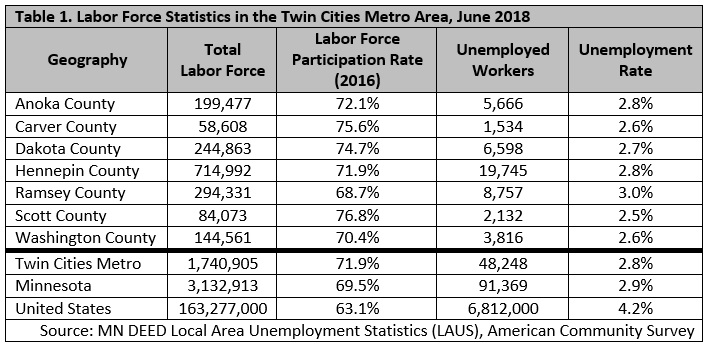
Now that we understand these concepts of the labor market, we turn to the unemployment rate. At its most simple definition, the unemployment rate reflects the number of unemployed people as a percentage of the labor force. So let’s take a closer look at that 2.8 percent unemployment rate. The estimated number of unemployed persons in the Twin Cities Metro Area was 48,248 in June 2018. At the same time, the region’s total labor force was equal to 1,740,905 people. 48,248 divided by 1,740,905 is equal to 2.8 percent. Voila! The region’s unemployment rate.
Hovering around 2.7 percent since late 2017, the unemployment rate hasn’t been this low in the Twin Cities Metro Area since December 2000. The total number of unemployed people, at just over 48,000, hasn’t been this low since May 2001.
Unemployment is extremely low across the Metro. At 2.5 percent, Scott County has the lowest unemployment rate of any metro county, which represents approximately 2,100 unemployed persons. At 3.0 percent, Ramsey County has the highest unemployment rate in the metro, representing about 8,800 unemployed persons. However, 3.0 percent is still very low, being significantly lower than the national unemployment rate of 4.2 percent. With about 20,000 unemployed persons, Hennepin County has the highest number of unemployed of any metro county. With just under 715,000 people in its labor force, however, the county also has a very low unemployment rate, at 2.8 percent. Note that all of these unemployment rates are not seasonally-adjusted (Table 1).

Contact Tim O'Neill at 651-259-7401.